OPEN-SOURCE SCRIPT
1000SATS and ORDI Market Cap Ratio
Sure! Here is a detailed description and usage guide for your TradingView indicator:
### Indicator Description
**Title**: 1000SATS/ORDI Market Cap Ratio
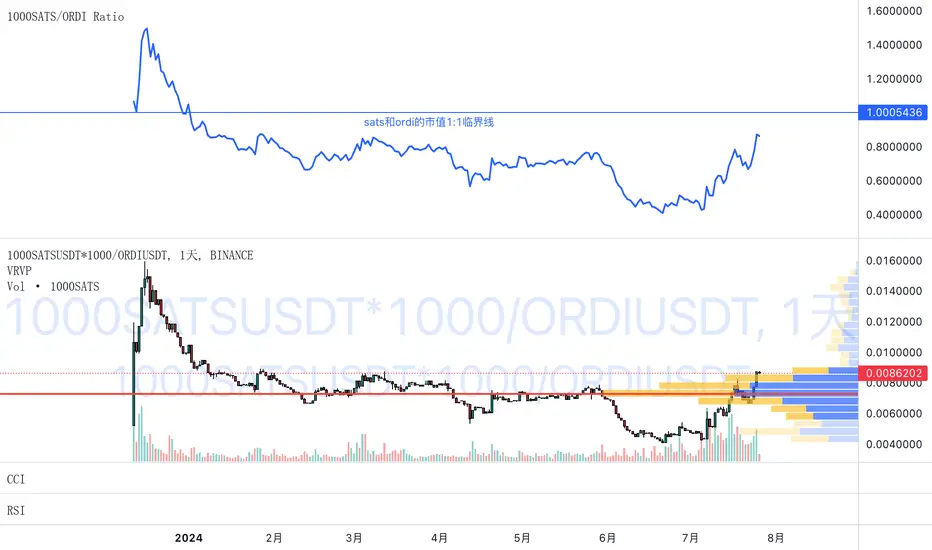
**Description**: The "1000SATS/ORDI Market Cap Ratio" indicator calculates and visualizes the market capitalization ratio between 1000SATS and ORDI. This indicator allows traders and investors to analyze the relative market strength and valuation trends of 1000SATS compared to ORDI over time. By tracking this ratio, users can gain insights into market dynamics and potential trading opportunities between these two assets.
### Indicator Usage
**Purpose**:
- To compare the market capitalizations of 1000SATS and ORDI.
- To identify potential undervaluation or overvaluation of 1000SATS relative to ORDI.
- To assist in making informed trading and investment decisions based on market cap trends.
**How to Use**:
1. **Add the Indicator to Your Chart**:
- Open TradingView and navigate to your chart.
- Click on the "Indicators" button at the top of the chart.
- Select "Pine Editor" and paste the provided script.
- Click "Add to Chart" to apply the indicator.
2. **Interpret the Ratio**:
- The indicator will plot a line representing the ratio of the market capitalization of 1000SATS to ORDI.
- A rising ratio indicates that the market cap of 1000SATS is increasing relative to ORDI, suggesting stronger market performance or higher valuation of 1000SATS.
- A falling ratio indicates that the market cap of 1000SATS is decreasing relative to ORDI, suggesting weaker market performance or lower valuation of 1000SATS.
3. **Analyze Trends**:
- Use the indicator to spot trends and potential reversal points in the market cap ratio.
- Combine the ratio analysis with other technical indicators and chart patterns to enhance your trading strategy.
4. **Set Alerts**:
- Set custom alerts on the ratio to notify you of significant changes or specific thresholds being reached, enabling timely decision-making.
**Example**:
- If the ratio is consistently rising, it may indicate a good opportunity to consider 1000SATS as a stronger investment relative to ORDI.
- Conversely, if the ratio is falling, it may be a signal to reevaluate the strength of 1000SATS compared to ORDI.
**Note**: Always conduct thorough analysis and consider other market factors before making trading decisions based on this indicator.
### Script
Pine Script®
This description and usage guide should help users understand the purpose and functionality of your indicator, as well as how to effectively apply it in their trading activities on TradingView.
### Indicator Description
**Title**: 1000SATS/ORDI Market Cap Ratio
**Description**: The "1000SATS/ORDI Market Cap Ratio" indicator calculates and visualizes the market capitalization ratio between 1000SATS and ORDI. This indicator allows traders and investors to analyze the relative market strength and valuation trends of 1000SATS compared to ORDI over time. By tracking this ratio, users can gain insights into market dynamics and potential trading opportunities between these two assets.
### Indicator Usage
**Purpose**:
- To compare the market capitalizations of 1000SATS and ORDI.
- To identify potential undervaluation or overvaluation of 1000SATS relative to ORDI.
- To assist in making informed trading and investment decisions based on market cap trends.
**How to Use**:
1. **Add the Indicator to Your Chart**:
- Open TradingView and navigate to your chart.
- Click on the "Indicators" button at the top of the chart.
- Select "Pine Editor" and paste the provided script.
- Click "Add to Chart" to apply the indicator.
2. **Interpret the Ratio**:
- The indicator will plot a line representing the ratio of the market capitalization of 1000SATS to ORDI.
- A rising ratio indicates that the market cap of 1000SATS is increasing relative to ORDI, suggesting stronger market performance or higher valuation of 1000SATS.
- A falling ratio indicates that the market cap of 1000SATS is decreasing relative to ORDI, suggesting weaker market performance or lower valuation of 1000SATS.
3. **Analyze Trends**:
- Use the indicator to spot trends and potential reversal points in the market cap ratio.
- Combine the ratio analysis with other technical indicators and chart patterns to enhance your trading strategy.
4. **Set Alerts**:
- Set custom alerts on the ratio to notify you of significant changes or specific thresholds being reached, enabling timely decision-making.
**Example**:
- If the ratio is consistently rising, it may indicate a good opportunity to consider 1000SATS as a stronger investment relative to ORDI.
- Conversely, if the ratio is falling, it may be a signal to reevaluate the strength of 1000SATS compared to ORDI.
**Note**: Always conduct thorough analysis and consider other market factors before making trading decisions based on this indicator.
### Script
```pinescript
//@version=4
study("1000SATS and ORDI Market Cap Ratio", shorttitle="1000SATS/ORDI Ratio", overlay=true)
// Define the circulating supply for ORDI and 1000SATS
ORDI_supply = 21000000 // Circulating supply of ORDI
SATS_1000_supply = 2100000000000 // Circulating supply of 1000SATS
// Fetch the price data for ORDI
ordi_price = security("BINANCE:ORDIUSDT", timeframe.period, close)
// Fetch the price data for 1000SATS
sats_1000_price = security("BINANCE:1000SATSUSDT", timeframe.period, close)
// Calculate the market capitalizations
ordi_market_cap = ordi_price * ORDI_supply
sats_1000_market_cap = sats_1000_price * SATS_1000_supply
// Calculate the market cap ratio
ratio = sats_1000_market_cap / ordi_market_cap
// Plot the ratio
plot(ratio, title="1000SATS/ORDI Market Cap Ratio", color=color.blue, linewidth=2)
```
This description and usage guide should help users understand the purpose and functionality of your indicator, as well as how to effectively apply it in their trading activities on TradingView.
Open-source script
In true TradingView spirit, the creator of this script has made it open-source, so that traders can review and verify its functionality. Kudos to the author! While you can use it for free, remember that republishing the code is subject to our House Rules.
加密超级alpha猎手
联系微信:btc20272027
联系微信:btc20272027
Disclaimer
The information and publications are not meant to be, and do not constitute, financial, investment, trading, or other types of advice or recommendations supplied or endorsed by TradingView. Read more in the Terms of Use.