ETH MVRV Z Score
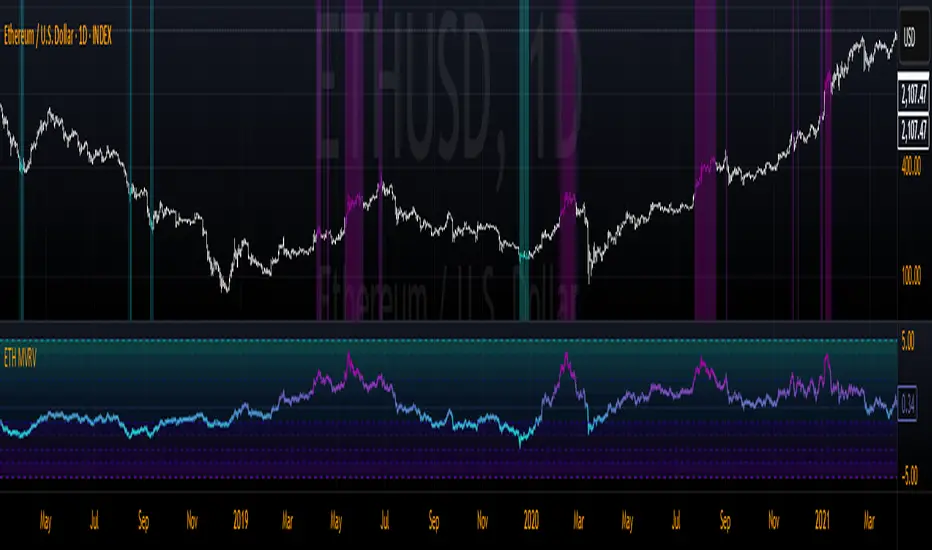
The indicator calculates the Z-score of the MVRV ratio over a user-defined lookback period, visually representing how far the current MVRV deviates from its mean in terms of standard deviations. It features customizable overbought and oversold thresholds, a gradient-based color system for easy interpretation, and optional chart coloring to highlight key market conditions. Horizontal lines and filled zones provide additional context for interpreting the Z-score levels, ranging from extreme undervaluation to extreme overvaluation.
Key Features:
- Z-Score Calculation: Measures the deviation of ETH’s MVRV ratio from its historical average, normalized by standard deviation.
- Customizable Settings: Adjust the lookback length for the Z-score calculation, as well as overbought and oversold thresholds.
- Color Gradient: Visualizes the Z-score with a smooth gradient, transitioning between user-defined colors for oversold, neutral, and overbought states.
- Optional Chart Colors: When enabled, applies dynamic coloring to candlesticks and backgrounds based on the Z-score, enhancing visual analysis.
- Horizontal Levels: Displays predefined Z-score levels (from -5 to 5) with shaded zones to mark significant thresholds.
Inputs:
- Z Length: The lookback period for calculating the Z-score (default: 150).
- Overbought Z Score: The threshold above which ETH is considered overbought (default: 2).
- Oversold Z Score: The threshold below which ETH is considered oversold (default: -2).
- Chart Colors: Toggle to enable/disable dynamic candlestick and background coloring.
- Color Options: Customize colors for oversold, overbought, and neutral zones.
How to Use:
A Z-score above the overbought threshold (e.g., 2) may suggest ETH is overvalued, potentially signaling a selling opportunity.
A Z-score below the oversold threshold (e.g., -2) may indicate undervaluation, potentially signaling a buying opportunity.
The gradient and optional chart colors help quickly identify market conditions, while the horizontal lines provide reference points for extreme deviations.
Best For:
- Long-term investors assessing ETH’s valuation.
- Traders looking for mean-reversion opportunities.
- Analysts combining on-chain metrics with technical analysis.
Invite-only script
Only users approved by the author can access this script. You'll need to request and get permission to use it. This is typically granted after payment. For more details, follow the author's instructions below or contact MarktQuant directly.
Note that this private, invite-only script has not been reviewed by script moderators, and its compliance with House Rules is undetermined. TradingView does NOT recommend paying for or using a script unless you fully trust its author and understand how it works. You may also find free, open-source alternatives in our community scripts.
Author's instructions
📊 whop.com/marktquant
🌐 marktquant.com
Nothing shared on this page constitutes financial advice. All information, tools, and analyses are provided solely for informational and educational purposes.
Disclaimer
Invite-only script
Only users approved by the author can access this script. You'll need to request and get permission to use it. This is typically granted after payment. For more details, follow the author's instructions below or contact MarktQuant directly.
Note that this private, invite-only script has not been reviewed by script moderators, and its compliance with House Rules is undetermined. TradingView does NOT recommend paying for or using a script unless you fully trust its author and understand how it works. You may also find free, open-source alternatives in our community scripts.
Author's instructions
📊 whop.com/marktquant
🌐 marktquant.com
Nothing shared on this page constitutes financial advice. All information, tools, and analyses are provided solely for informational and educational purposes.