OPEN-SOURCE SCRIPT
Index Breadth Percent of Stocks above Key Moving Averages
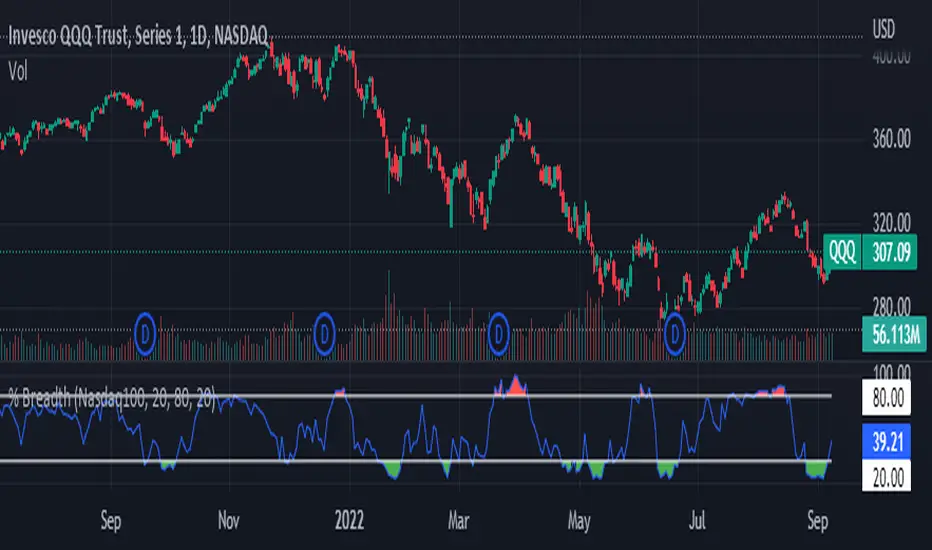
This Indicator will plot the percent of stocks above key moving averages. This is a good way to monitor market breadth and help determine when the market is Overbought or Oversold.
Market Tickers Available = SP500, DJI, NQ, NQ100, R2000, R3000, SP500 Financials, SP500 Materials, SP500 Energy, SP500 Staples, SP500 Discretionary, SP500 Industrials, SP500 Real Estates, Overall Market
Market Tickers Available = SP500, DJI, NQ, NQ100, R2000, R3000, SP500 Financials, SP500 Materials, SP500 Energy, SP500 Staples, SP500 Discretionary, SP500 Industrials, SP500 Real Estates, Overall Market
Open-source script
In true TradingView spirit, the creator of this script has made it open-source, so that traders can review and verify its functionality. Kudos to the author! While you can use it for free, remember that republishing the code is subject to our House Rules.
Disclaimer
The information and publications are not meant to be, and do not constitute, financial, investment, trading, or other types of advice or recommendations supplied or endorsed by TradingView. Read more in the Terms of Use.