OPEN-SOURCE SCRIPT
Multi-TF EMA 5/8-ChartTicker-Dashboard
⚙️ Key Components
Timeframes & Weights
Uses 5 different intraday timeframes: 2m, 5m, 15m, 30m, 60m.
Each TF has a weight:
2m = 1
5m = 2
15m = 4
30m = 8
60m = 16
👉 Higher timeframe signals contribute more to the total.
Signal Logic per Timeframe
For each TF, calculate EMA 5 and EMA 8.
If EMA5 > EMA8 → Buy (B, +1).
If EMA5 < EMA8 → Sell (S, –1).
Total Score Calculation
Each signal (+1 or –1) is multiplied by its timeframe weight.
All weighted signals are summed into a total score.
Positive = bullish bias, negative = bearish bias.
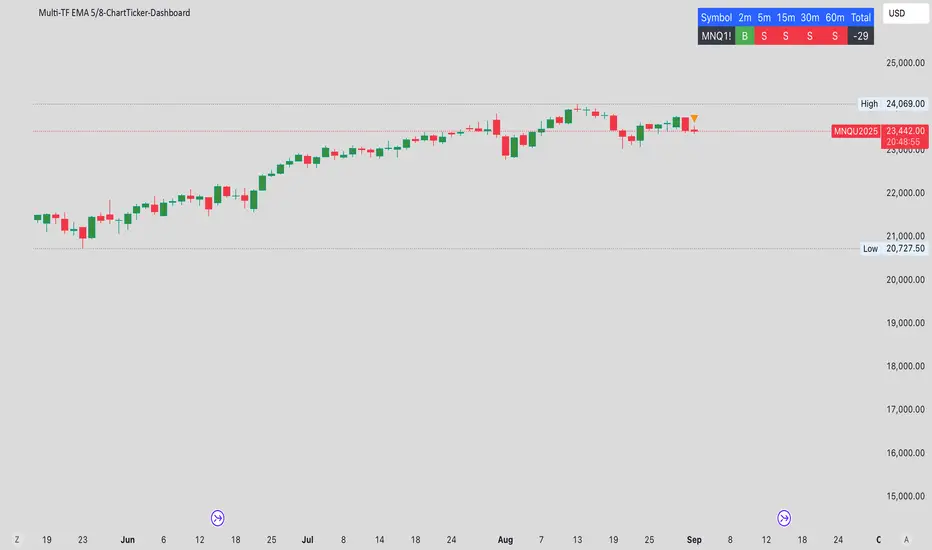
Dashboard Table (top-right corner)
Row 1 (header): Symbol, each timeframe (2m, 5m, 15m, 30m, 60m), Total.
Row 2 (values):
Symbol name.
B (green) or S (red) per timeframe.
Weighted Total score.
🛠️ Overall Function
This indicator is essentially a multi-timeframe EMA trend dashboard that:
Shows Buy/Sell alignment across multiple TFs.
Provides a weighted trend score to quickly assess market bias.
Makes it easy to spot whether short- and long-term signals agree or conflict.
Timeframes & Weights
Uses 5 different intraday timeframes: 2m, 5m, 15m, 30m, 60m.
Each TF has a weight:
2m = 1
5m = 2
15m = 4
30m = 8
60m = 16
👉 Higher timeframe signals contribute more to the total.
Signal Logic per Timeframe
For each TF, calculate EMA 5 and EMA 8.
If EMA5 > EMA8 → Buy (B, +1).
If EMA5 < EMA8 → Sell (S, –1).
Total Score Calculation
Each signal (+1 or –1) is multiplied by its timeframe weight.
All weighted signals are summed into a total score.
Positive = bullish bias, negative = bearish bias.
Dashboard Table (top-right corner)
Row 1 (header): Symbol, each timeframe (2m, 5m, 15m, 30m, 60m), Total.
Row 2 (values):
Symbol name.
B (green) or S (red) per timeframe.
Weighted Total score.
🛠️ Overall Function
This indicator is essentially a multi-timeframe EMA trend dashboard that:
Shows Buy/Sell alignment across multiple TFs.
Provides a weighted trend score to quickly assess market bias.
Makes it easy to spot whether short- and long-term signals agree or conflict.
Open-source script
In true TradingView spirit, the creator of this script has made it open-source, so that traders can review and verify its functionality. Kudos to the author! While you can use it for free, remember that republishing the code is subject to our House Rules.
Disclaimer
The information and publications are not meant to be, and do not constitute, financial, investment, trading, or other types of advice or recommendations supplied or endorsed by TradingView. Read more in the Terms of Use.