OPEN-SOURCE SCRIPT
CME FX Futures Correlation Matrix
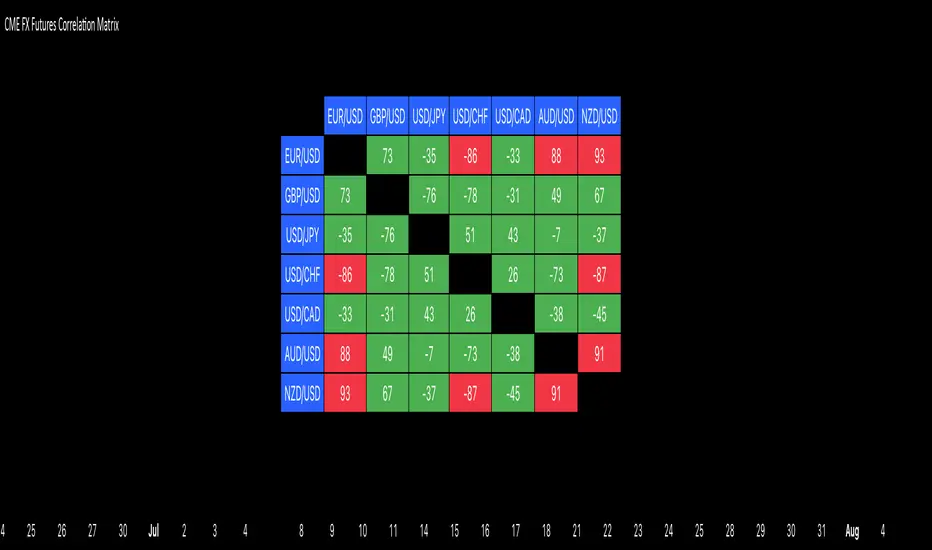
This indicator calculates the correlation between major CME FX futures and displays it in a visual table. It shows how closely pairs like EUR/USD, GBP/USD, USD/JPY, USD/CHF, USD/CAD, AUD/USD, and NZD/USD move together or in opposite directions.
The indicator inherits the timeframe of the chart it’s applied to.
Color coding:
How to launch it
The indicator inherits the timeframe of the chart it’s applied to.
Color coding:
- Red: strong correlation (absolute value > 80%), both positive and negative
- Green: moderate/low correlation
How to launch it
- Apply the indicator to a CME chart (e.g., EUR/USD futures).
- Set Numbers of Bars Back to the desired lookback period (default 100).
- The table appears in the center of the chart, showing correlation percentages between all major FX futures.
Open-source script
In true TradingView spirit, the creator of this script has made it open-source, so that traders can review and verify its functionality. Kudos to the author! While you can use it for free, remember that republishing the code is subject to our House Rules.
Disclaimer
The information and publications are not meant to be, and do not constitute, financial, investment, trading, or other types of advice or recommendations supplied or endorsed by TradingView. Read more in the Terms of Use.