Crowd Tracker (work in progress)
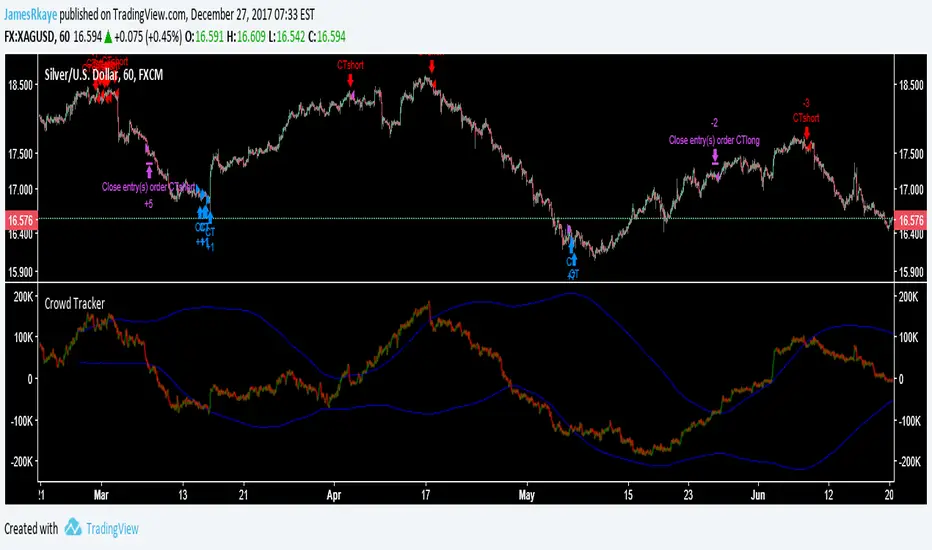
This is still work in progress because I want to find a better way to find the tops and bottoms of the Crowd Tracker, so it is set to invite only, after I have completed it I will probably release it in protected so follow me if you want to use it later on :) It is good at spotting entries for cryptos and stock indexes however the exits still need work.
Invite-only script
Only users approved by the author can access this script. You'll need to request and get permission to use it. This is typically granted after payment. For more details, follow the author's instructions below or contact JamesRkaye directly.
TradingView does NOT recommend paying for or using a script unless you fully trust its author and understand how it works. You may also find free, open-source alternatives in our community scripts.
Author's instructions
Disclaimer
Invite-only script
Only users approved by the author can access this script. You'll need to request and get permission to use it. This is typically granted after payment. For more details, follow the author's instructions below or contact JamesRkaye directly.
TradingView does NOT recommend paying for or using a script unless you fully trust its author and understand how it works. You may also find free, open-source alternatives in our community scripts.