OPEN-SOURCE SCRIPT
EMA Channel Key K-Lines
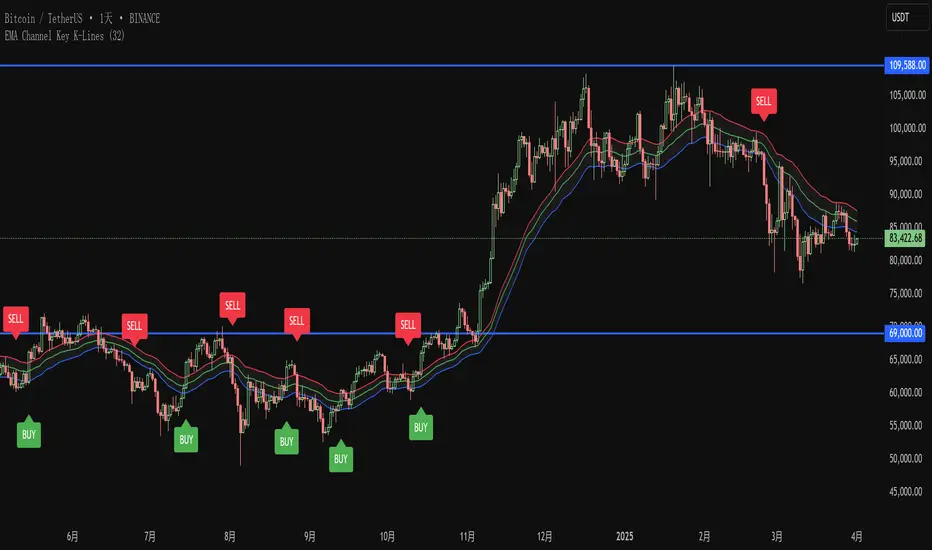
EMA Channel Setup:
Key K-line Identification:
Visual Markers:
Logic Flow:
- Three 32-period EMAs (high, low, close prices)
- Visually distinct colors (red, blue, green)
- Gray background between high and low EMAs
Key K-line Identification:
- For buy signals: Close > highest EMA, K-line height ≥ channel height, body ≥ 2/3 of range
- For sell signals: Close < lowest EMA, K-line height ≥ channel height, body ≥ 2/3 of range
- Alternating signals only (no consecutive buy/sell signals)
Visual Markers:
- Green "BUY" labels below key buy K-lines
- Red "SELL" labels above key sell K-lines
- Clear channel visualization
Logic Flow:
- Tracks last signal direction to prevent consecutive same-type signals
- Strict conditions ensure only significant breakouts are marked
- All calculations based on your exact specifications
Open-source script
In true TradingView spirit, the creator of this script has made it open-source, so that traders can review and verify its functionality. Kudos to the author! While you can use it for free, remember that republishing the code is subject to our House Rules.
Disclaimer
The information and publications are not meant to be, and do not constitute, financial, investment, trading, or other types of advice or recommendations supplied or endorsed by TradingView. Read more in the Terms of Use.