PROTECTED SOURCE SCRIPT
Stochastic by Edwin K
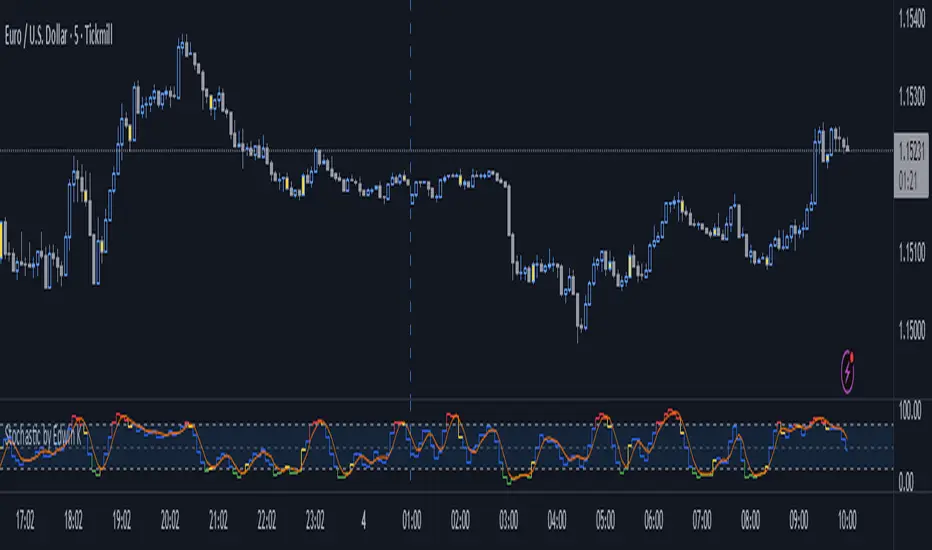
What it shows
This indicator measures momentum and overbought/oversold zones using the Stochastic Oscillator (%K and %D).
It helps you see when price momentum is **turning**, **overextended**, or **ready to reverse**.
How to read it
Blue line (%K): Fast momentum line — reacts quickly to price.
Orange line (%D):Slow signal line — confirms direction.
Zone shading:
Above 80 = Overbought zone (price stretched upward)
Below 20 = Oversold zone (price stretched downward)
Bar turns yellow: momentum warning — possible reversal or pullback coming.
Yellow signal meaning
The bar turns yellow when:
%K crosses below 80 (momentum leaving overbought zone → early sell signal) or
%K crosses above 20 (momentum leaving oversold zone → early buy signal).
This is your momentum shift alert — the market may start reversing or correcting soon.
How to trade it
1. Reversal entries
Buy when %K crosses up through 20 (oversold to bullish).
Sell when %K crosses down through 80 (overbought to bearish).
Yellow bars confirm the shift.
2. Trend filter
For better accuracy, confirm with trend direction (e.g., EMA or price structure):
Only take buy signals when price is above an EMA (e.g., 50 EMA).
Only take sell signals when price is below it.
Protected script
This script is published as closed-source. However, you can use it freely and without any limitations – learn more here.
Disclaimer
The information and publications are not meant to be, and do not constitute, financial, investment, trading, or other types of advice or recommendations supplied or endorsed by TradingView. Read more in the Terms of Use.