OPEN-SOURCE SCRIPT
Updated Price Iterations with Pips
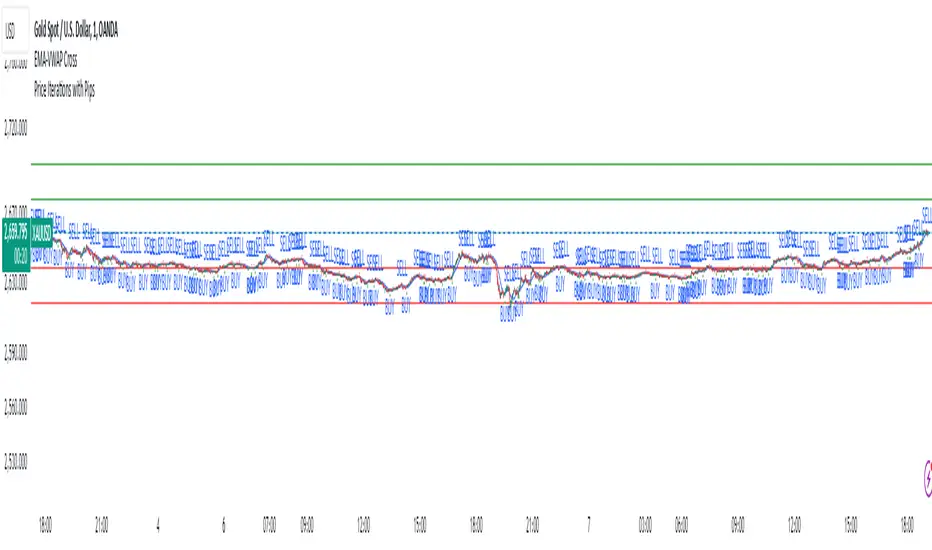
*Script Name:* Price Iterations with Pips
*Description:* This script plots horizontal lines above and below a user-defined initial price, representing price iterations based on a specified number of pips.
*Functionality:*
1. Asks for user input:
- Initial Price
- Pips per Iteration
- Number of Iterations
2. Calculates the price change per pip.
3. Plots horizontal lines:
- Above the initial price (green)
- Below the initial price (red)
4. Extends lines dynamically to both sides.
*Use Cases:*
1. *Support and Resistance Levels:* Use the script to visualize potential support and resistance levels based on price iterations.
2. *Price Targets:* Set the initial price as a target and use the iterations to estimate potential profit/loss levels.
3. *Risk Management:* Utilize the script to visualize risk levels based on pip iterations.
4. *Technical Analysis:* Combine the script with other technical indicators to identify potential trading opportunities.
*Trading Platforms:* This script is designed for TradingView.
*How to Use:*
1. Add the script to your TradingView chart.
2. Set the initial price, pips per iteration, and number of iterations.
3. Adjust the colors and line styles as needed.
4. Zoom in/out and pan to see the lines adjust.
*Benefits:*
1. Visualize price iterations and potential support/resistance levels.
2. Simplify risk management and price target estimation.
3. Enhance technical analysis with customizable price levels.
Release Notes
I have updated the Multiplier value,Users have to Insert the current price of the Instrument and experiment with the Multiplier value and Pips per Iteration to mark the Equidistant levels from the given Initial value.
Release Notes
Corrected the Mistakes in codeOpen-source script
In true TradingView spirit, the creator of this script has made it open-source, so that traders can review and verify its functionality. Kudos to the author! While you can use it for free, remember that republishing the code is subject to our House Rules.
Disclaimer
The information and publications are not meant to be, and do not constitute, financial, investment, trading, or other types of advice or recommendations supplied or endorsed by TradingView. Read more in the Terms of Use.
Open-source script
In true TradingView spirit, the creator of this script has made it open-source, so that traders can review and verify its functionality. Kudos to the author! While you can use it for free, remember that republishing the code is subject to our House Rules.
Disclaimer
The information and publications are not meant to be, and do not constitute, financial, investment, trading, or other types of advice or recommendations supplied or endorsed by TradingView. Read more in the Terms of Use.