OPEN-SOURCE SCRIPT
FXS
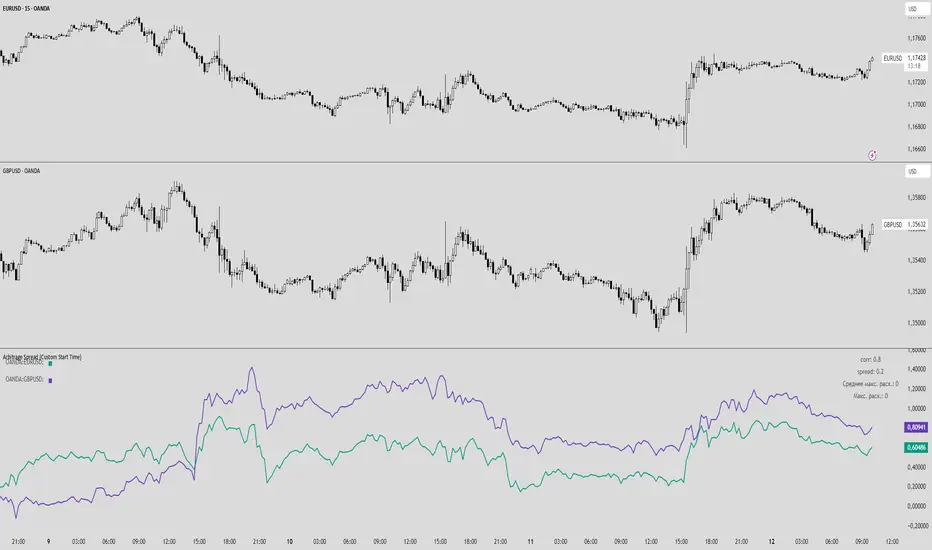
Arbitrage Spread (Custom Start Time)
This indicator analyzes the spread and correlation between two selected instruments or currency pairs.
Key Features:
Displays the percentage change of the two instruments in a separate chart (does not overlay the main chart).
Lines show the entire historical price movement of the selected instruments.
Calculates the current spread and correlation from a chosen date and time (default — last Monday 00:00).
Spread and corr values are rounded to two decimal places for convenience.
The top-right table displays:
corr — correlation coefficient between the instruments,
spread — current spread between the pairs,
Average max deviation for the period — manual input,
Maximum deviation for the entire period — manual input.
The top-left table shows the color of each pair for clarity.
Alerts can be set for specific corr and spread values.
Features:
Historical lines allow visual tracking of dynamics over the entire available period.
Current spread is calculated separately from the selected start time, allowing analysis of current conditions without affecting historical visualization.
Fully customizable: line colors, calculation period, start date/time for spread, manual statistical data.
Open-source script
In true TradingView spirit, the creator of this script has made it open-source, so that traders can review and verify its functionality. Kudos to the author! While you can use it for free, remember that republishing the code is subject to our House Rules.
Disclaimer
The information and publications are not meant to be, and do not constitute, financial, investment, trading, or other types of advice or recommendations supplied or endorsed by TradingView. Read more in the Terms of Use.