OPEN-SOURCE SCRIPT
Updated Fibo Candle Middle Line
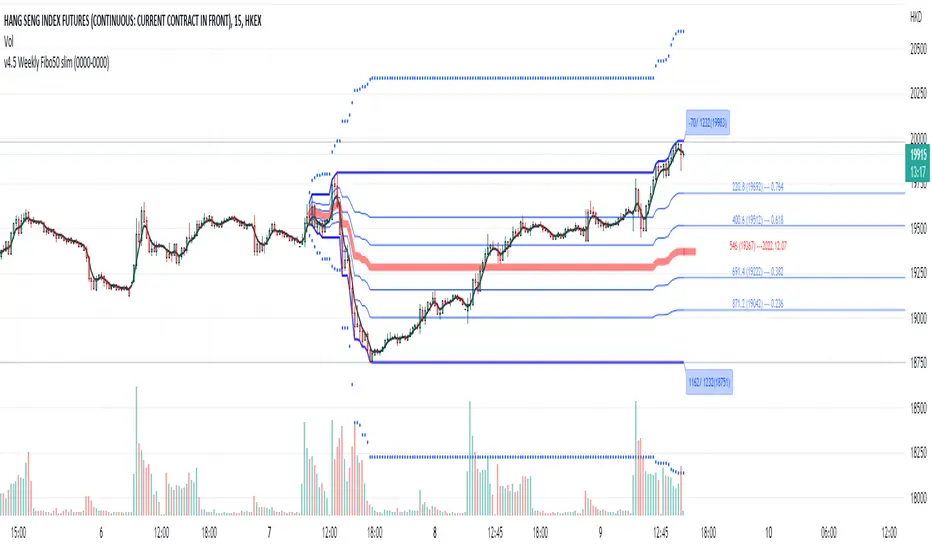
Adopt the idea of Fibo retracement 50% line, if a retracement move more than 50%, it is likely that the retracement will continue and made a new high or new low with 1.618 ratio from the middle line. You will find that the fibo 50% line also works as a support and resistance. The Dotted line is the projected 1.618 fibo target.
Release Notes
The blue line is the fibo 50% middle line of a day candle. When bull and bear fight, the forming of bear and bull, need to break the Fibo 50% line first, once it break, the winning party will go to the 1.618 target line. To use this indicator, you can observe how it react at the middle line, if it win, you may set your take profit point as at te dotted line (1.618) at the time of rebound. Release Notes
Highlight functionYou can adjust the range of the fibo by clicking the indicator on the chart as well as using the indicator set up to input the begin date/time.
I find the dragging on the chart to adjust begin date/time is very useful
How to use?
1. Select the indicator on the chart
2. Move the mouse to the "square" symbol at the begining of the period
3. You can drag to change the begin date/time
Open-source script
In true TradingView spirit, the creator of this script has made it open-source, so that traders can review and verify its functionality. Kudos to the author! While you can use it for free, remember that republishing the code is subject to our House Rules.
Disclaimer
The information and publications are not meant to be, and do not constitute, financial, investment, trading, or other types of advice or recommendations supplied or endorsed by TradingView. Read more in the Terms of Use.