PROTECTED SOURCE SCRIPT
Updated Currency Index - based on Correlation Coefficient
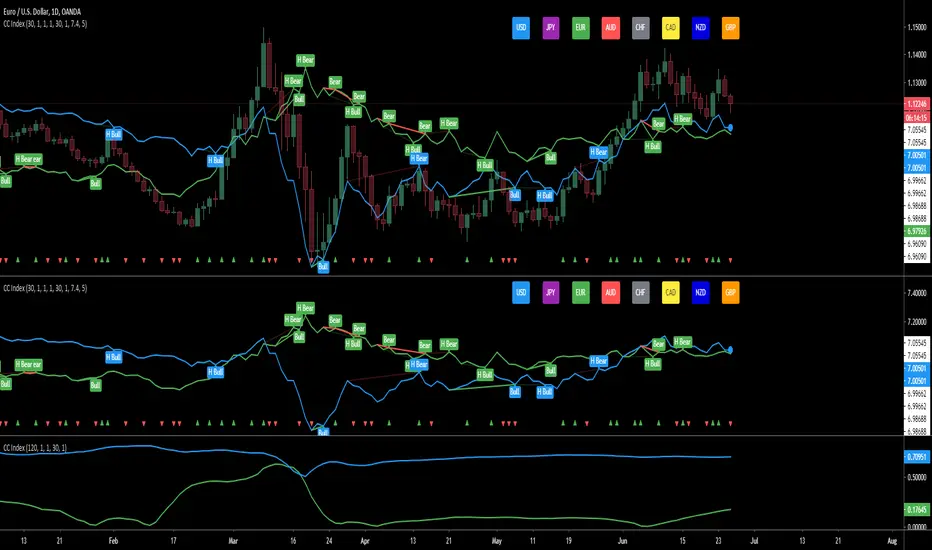
The script is calculating the correlation between the current pair and the corresponding indexes and then displays the driving index based on the higher correlation.
for example: on EURUSD - calculates the correlation between EURUSD with the USD index and the correlation between EURUSD with the EUR index and then displays the winning/driving index.
- the arrows at the bottom are showing when both indexes are going in the same direction
- there are options to show divergences on the winning index
- option to display either the correlation or the winning index
- and option to be able to use while in replay mode for back testing, based on the last close to avoid repainting
- option for the length of the correlation
- the last color of the driving index is related to the index that is being displayed where:
AUD - red
CAD - yellow
CHF - grey
EUR - green
GBP - orange
JPY - magenta
NZD - dark blue
USD - light blue
- it works automatically on all the major pairs
- the last 4 options are for finding divergences between the price and the index
Release Notes
- fixed a bug from the previous version: even though the colors and correlations were correct ....the driver index displayed was always the second one .... the inverse quote currency index.- as the base currency index has values around 7 and the inverse quote currency index had values around 0.14 ..... displaying both on the same chart would look bad because of the scale difference....
as a result of that and some pinescript limitations, i have normalized the inverse quote currency index, based on the min and max values of the quote so they get displayed nicely
- the Driving index will have a circle/dot in the same color of the index plotted on top of the last value
- I am not super happy about the way the divergence works and will get revamped soon
Release Notes
I have updated the divergences. It now displays regular and hidden divergences on each index separately. Calculations are made between each index and the highs/lows of the pair.- regular bullish divergence = green line
- hidden bullish divergence = 50% transparent green line
- regular bearish divergence = red line
- hidden bearish divergence = 50% transparent green line
- the background of the labels have the same color as the index that the divergence is referring to
Release Notes
-Added labelsProtected script
This script is published as closed-source. However, you can use it freely and without any limitations – learn more here.
Disclaimer
The information and publications are not meant to be, and do not constitute, financial, investment, trading, or other types of advice or recommendations supplied or endorsed by TradingView. Read more in the Terms of Use.
Protected script
This script is published as closed-source. However, you can use it freely and without any limitations – learn more here.
Disclaimer
The information and publications are not meant to be, and do not constitute, financial, investment, trading, or other types of advice or recommendations supplied or endorsed by TradingView. Read more in the Terms of Use.