PROTECTED SOURCE SCRIPT
Updated DV Master RSI
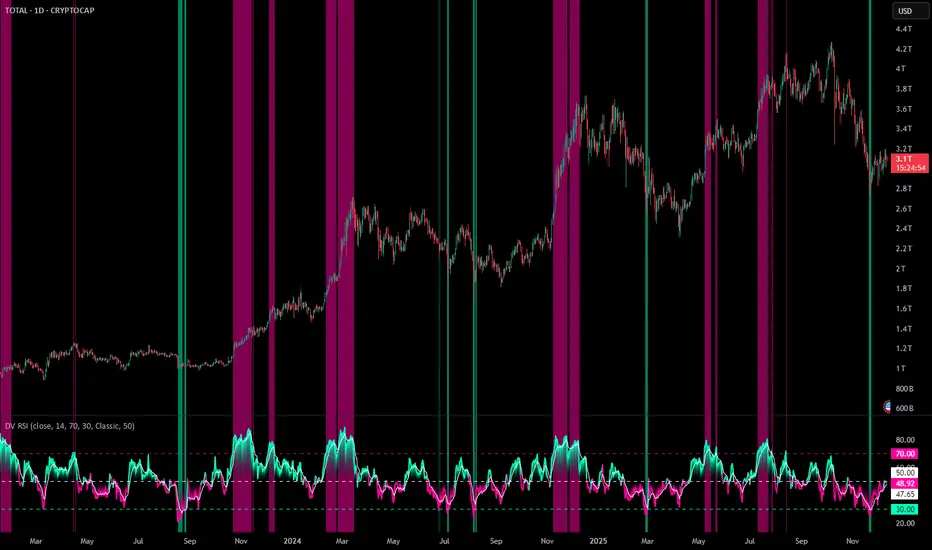
DV Master RSI
Executive Summary
The Relative Strength Index (RSI) is one of the most foundational and widely utilized momentum oscillators in technical analysis. While traditionally used to gauge overbought and oversold conditions, its true power lies in identifying subtle shifts in market momentum and divergence from price action. The DV Master RSI Indicator is a sophisticated Pine Script tool designed to leverage the full strategic potential of the RSI by integrating multiple advanced signaling methods, comprehensive visual customization, and a robust anti-repainting feature. This indicator transforms the classic RSI into a complete, multi-signal trading system.
Key Advanced Features of the DV Master RSI
This indicator is engineered to provide traders with comprehensive momentum analysis and actionable signals through several integrated modules:
Features
Momentum Signaling:
RSI Midline Cross (50-line) Confirms shifts from bearish to bullish momentum and vice-versa.
RSI Moving Average Crossover:
Provides smoothed, less noisy trend confirmation and early entry/exit signals.
Trend Confirmation:
RSI MA Midline Cross uses the trend of the RSI's Moving Average to confirm the overall market bias.
Overbought/Oversold Signals
Visually highlights extreme momentum conditions for potential reversals.
Predictive Analysis
Bullish & Bearish Divergence identifies classic market turning points when price makes new highs/lows but RSI does not.
Hidden Divergence
Signals trend continuation, indicating strong internal momentum supporting the current trend.
Performance Assurance
Anti-Repainting Switch ensures signal integrity for backtesting and live trading by locking critical values on bar closure.
Visual Customization
10 Color Palettes & Background Painting enhances clarity and trading focus with custom colors and visual alerts on the chart and indicator panel.
Strategic Application for Traders
The integration of these features allows traders to employ strategies far beyond simple overbought/oversold monitoring.
Divergence Trading (Predictive Edge):
Divergence is often considered the most powerful signal from a momentum oscillator.
Regular Divergence (Reversal):
When the price makes a Lower Low but the RSI makes a Higher Low, it suggests the downward momentum is weakening, signaling a potential Bullish Reversal. The indicator plots this signal directly, giving traders an early warning to cover shorts or initiate long positions.
Hidden Divergence (Continuation):
This feature is crucial for trend-following. When the price makes a Higher Low but the RSI makes a Lower Low (during an uptrend), it signals that the trend is strong and likely to continue. Traders can use this for confident re-entry into established trends.
Signal Integrity and Backtesting Reliability:
The dedicated Anti-Repainting Switch is paramount for serious algorithmic and discretionary traders.
Problem: Indicators that use real-time price data (like close on the current bar) can change their signal retroactively as the current bar develops. This leads to illusory performance in backtesting.
Solution: By enabling the non-repainting mode, the indicator ensures that all crucial signals (MA Crosses, Midline Crosses, etc.) are only finalized and plotted upon the full confirmation of the bar's closure. This guarantees that your backtested results accurately reflect what would have been tradable in real-time.
Customizable Smoothing:
The inclusion of nine different Moving Average types (EMA, DEMA, TEMA, HMA, SMA, SMA + Bollinger Bands, SMMA, WMA, VWMA) for the RSI line allows a trader to fine-tune the indicator's responsiveness to market noise.
A trader expecting a fast reaction to short-term events might use an EMA.
A trader looking for robust, volume-weighted confirmation might select the VWMA.
Furthermore, the dedicated switches for background color on the chart and the indicator panel provide immediate, non-intrusive visual confirmation of extreme conditions, allowing traders to quickly manage multiple charts.
The DV Master RSI is an essential upgrade for any trader who relies on momentum analysis, providing the precision, assurance, and strategic versatility required for modern market navigation.
Release Notes
Update:- Error in code.
Release Notes
Update:- Switched coloring of overbought and oversold signals.
Release Notes
Update:- Added the option to adjust the background color transparency under the "Visual" section.
Release Notes
Update:- Fix issue with transparency.
Release Notes
Update:- Update cover image.
Release Notes
Update:- Update default settings.
Release Notes
DV RSIThe DV RSI (Relative Strength Index) is a powerful and highly configurable technical indicator designed for analysts who demand both precision and control in their momentum studies. It combines the core Relative Strength Index (RSI) with a versatile Moving Average overlay and comprehensive visualization tools. It comes equipped with a dedicated Anti-Repainting Switch, which allows users to select the most appropriate calculation methodology for their analysis.
Features and Technical Controls
The DV RSI provides granular, modular control over all primary components:
Repainting:
The calculation strictly uses closed historical data. The signals generated on closed bars are permanent, ensuring definitive historical plotting and reliable backtesting results.
Modular Component Visibility:
RSI Switch: Show/hide the core RSI plot.
Moving Average Switch: Show/hide the Moving Average plot.
Background Color Switch: Independent controls to enable/disable overbought and oversold background shading on both the RSI pane and the main price chart.
Versatile Moving Average Library:
The built-in MA is highly adaptable, supporting multiple popular smoothing methods for generating customizable crossover signals on the RSI.
Application and Methodology
The DV RSI is optimized for high-level analytical utility.
Focused Analysis:
Users can disable the MA and all backgrounds to focus exclusively on the raw RSI line for classic divergence and center-line analysis.
Trend Confirmation:
The integration of the MA allows for advanced confirmation of momentum shifts (e.g., RSI crossing its own MA), providing a cleaner, self-contained momentum trend filter.
Contextual Visualization:
The Chart Background Switch projects the RSI's momentum extremes directly onto the price action, offering an immediate visual context for where the price is trading relative to overbought and oversold conditions.
The DV RSI Framework provides the necessary control over signal integrity and visual complexity, establishing itself as a definitive tool for sophisticated momentum analysis.
Protected script
This script is published as closed-source. However, you can use it freely and without any limitations – learn more here.
Disclaimer
The information and publications are not meant to be, and do not constitute, financial, investment, trading, or other types of advice or recommendations supplied or endorsed by TradingView. Read more in the Terms of Use.