OPEN-SOURCE SCRIPT
Updated AlphaDragon: Data visualizer
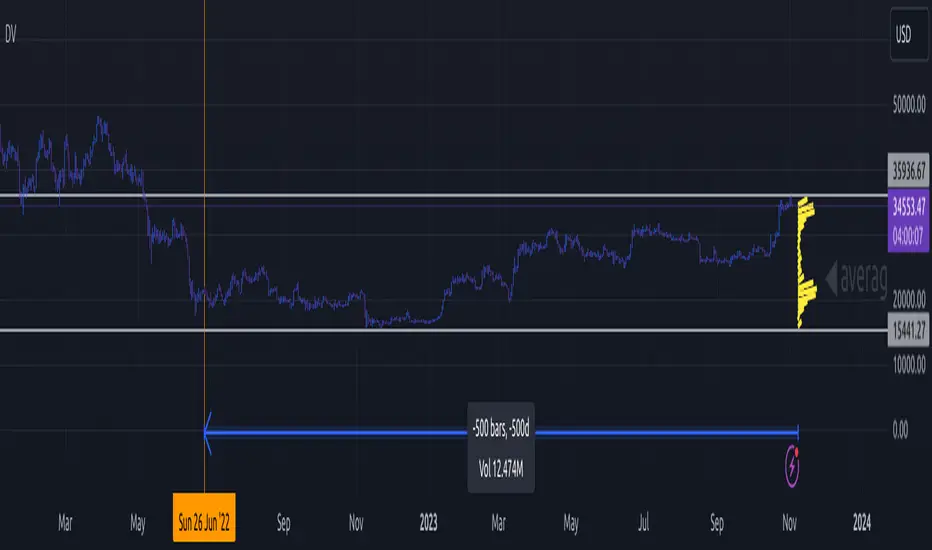
Aggregates source data into 2D vertical histogram.
Aggregates samples (lenght) in a window (from 0% to 100%). N samples are gathered in 1% brackets.
Visualizer gathers 5% of each window, and display width corresponding to amount of samples, in that bracket.
Aggregates samples (lenght) in a window (from 0% to 100%). N samples are gathered in 1% brackets.
Visualizer gathers 5% of each window, and display width corresponding to amount of samples, in that bracket.
Release Notes
Added math.round - but it does not fix the graph drawRelease Notes
Updated histogramin next version:
- projected two types of histogram
- Better, its own X/Y chart (one type)
- Updated this 2D as an overlay
Release Notes
updated chartOpen-source script
In true TradingView spirit, the creator of this script has made it open-source, so that traders can review and verify its functionality. Kudos to the author! While you can use it for free, remember that republishing the code is subject to our House Rules.
Disclaimer
The information and publications are not meant to be, and do not constitute, financial, investment, trading, or other types of advice or recommendations supplied or endorsed by TradingView. Read more in the Terms of Use.
Open-source script
In true TradingView spirit, the creator of this script has made it open-source, so that traders can review and verify its functionality. Kudos to the author! While you can use it for free, remember that republishing the code is subject to our House Rules.
Disclaimer
The information and publications are not meant to be, and do not constitute, financial, investment, trading, or other types of advice or recommendations supplied or endorsed by TradingView. Read more in the Terms of Use.