OPEN-SOURCE SCRIPT
RSI Price overlay on chart
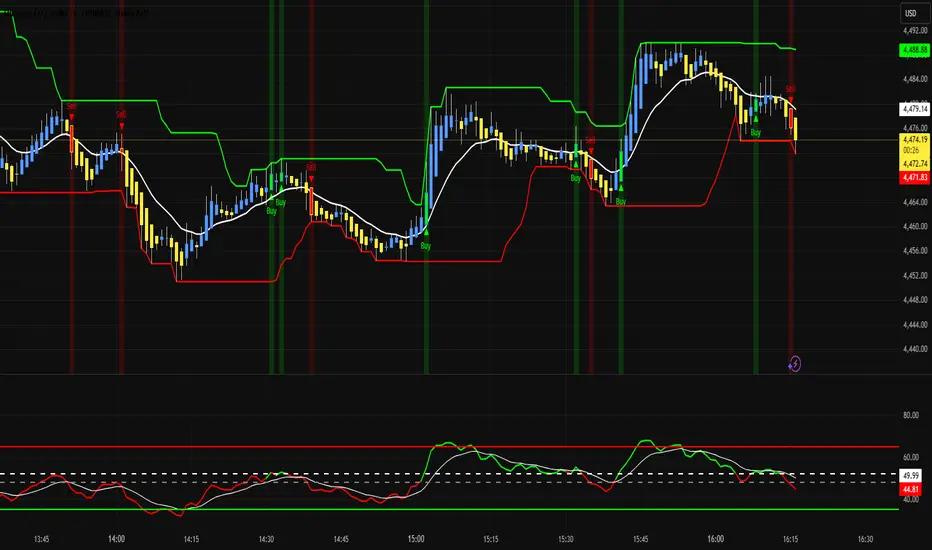
Thie Indicator plots buy and sell signals on the chart using the 28 period RSI with overbought areas at 65 and oversold at 35
Open-source script
In true TradingView spirit, the creator of this script has made it open-source, so that traders can review and verify its functionality. Kudos to the author! While you can use it for free, remember that republishing the code is subject to our House Rules.
Disclaimer
The information and publications are not meant to be, and do not constitute, financial, investment, trading, or other types of advice or recommendations supplied or endorsed by TradingView. Read more in the Terms of Use.