OPEN-SOURCE SCRIPT
High Volume Vector Candles
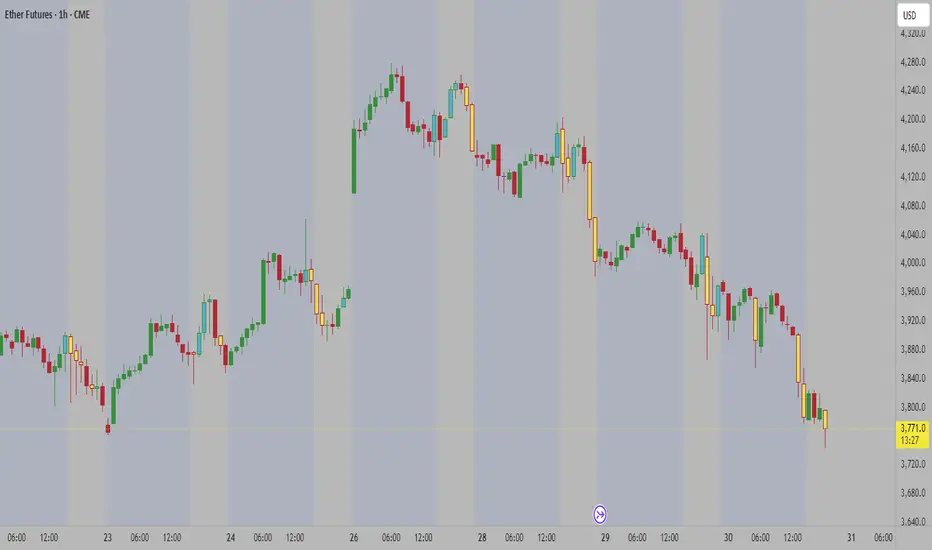
High Volume Vector Candles highlights candles where trading activity significantly exceeds the average, helping you quickly identify powerful moves driven by strong volume.
How it works:
- The script calculates a moving average of volume over a user-defined period.
- When current volume exceeds the chosen threshold (e.g. 150% of the average), the candle is marked as a high-volume event.
- Bullish high-volume candles are highlighted in blue tones, while bearish ones are shown in yellow, both with adjustable opacity.
This visualization makes it easier to spot potential breakout points, absorption zones, or institutional activity directly on your chart.
Customizable Settings:
• Moving average length
• Threshold percentage above average
• Bullish/Bearish highlight colors
• Opacity level
Ideal for traders who combine price action with volume analysis to anticipate market momentum.
Open-source script
In true TradingView spirit, the creator of this script has made it open-source, so that traders can review and verify its functionality. Kudos to the author! While you can use it for free, remember that republishing the code is subject to our House Rules.
Disclaimer
The information and publications are not meant to be, and do not constitute, financial, investment, trading, or other types of advice or recommendations supplied or endorsed by TradingView. Read more in the Terms of Use.