Hotzones Essentials
The Killzone Blocks are a precision-engineered market-mapping system designed to identify high-liquidity price regions zones where institutional participants and smart money are most likely to interact. These areas often act as reaction points, where liquidity absorption, reversals, or continuation moves are started. By highlighting these zones, traders can potentially anticipate market intent and position themselves accordingly with greater confidence.
Shown above is are Killzone Blocks highlighting their strength and deltas.
Killzone Blocks are dynamically generated from significant structural shifts in the market where key areas where order flow and volume imbalance indicate a change in control between buyers and sellers. Each block represents a localized liquidity pocket, allowing users to visualize potential killzones which are regions where price is statistically more likely to bounce, reject, or consolidate before choosing direction.
The algorithm continuously tracks structural breaks, pivot reactions, and volume clustering to ensure that every block represents a meaningful, data-driven region rather than random candle overlap.
Volume and Delta Analysis
Each Killzone Block carries an advanced volume breakdown that quantifies order-flow dynamics within the zone.
Volume Data: Displays both bullish and bearish volume as a percentage of the total block volume, quantifying buying vs. selling intensity and helping traders gauge whether the zone was dominated by aggressive buyers or sellers.
Gray Text (Order Block Volume Type): Shows metrics specific to the block’s nature.
- Bearish Blocks: Display only the bear volume (sell pressure) as a percentage of total OB volume.
- Bullish Blocks: Display only the bull volume (buy pressure) as a percentage of total OB volume.
This separation removes noise and helps traders focus on which participant truly dominated the zone.
Each block also features a Delta Indicator which is a color-coded circle offering instant insight into which side of the market was in control:
- 🔴 Red: Strong negative delta (-100% to -20%) = Sellers dominated.
- 🟡 Yellow: Neutral delta (-10% to +10%) = Market in balance or absorption.
- 🔵 Blue: Strong positive delta (+20% to +100%) = Buyers dominated.
The delta represents the difference between buyer and seller volume within that block. A positive delta indicates aggressive buying absorption, while a negative delta suggests sell-side control.
Shown above we see a very small delta with neutral volume. This is a very balanced market zone where we might be less likely to see a reaction.
Customization and Inputs
Users can tailor the Killzone Blocks to suit their analysis style:
* Adjust the displayed block count to view short-term or long-term structures.
* Choose whether zones are drawn from wicks or bodies. Wick-based zones are more reactive to intraday liquidity hunts, while body-based zones reflect institutional candle closings and conviction.
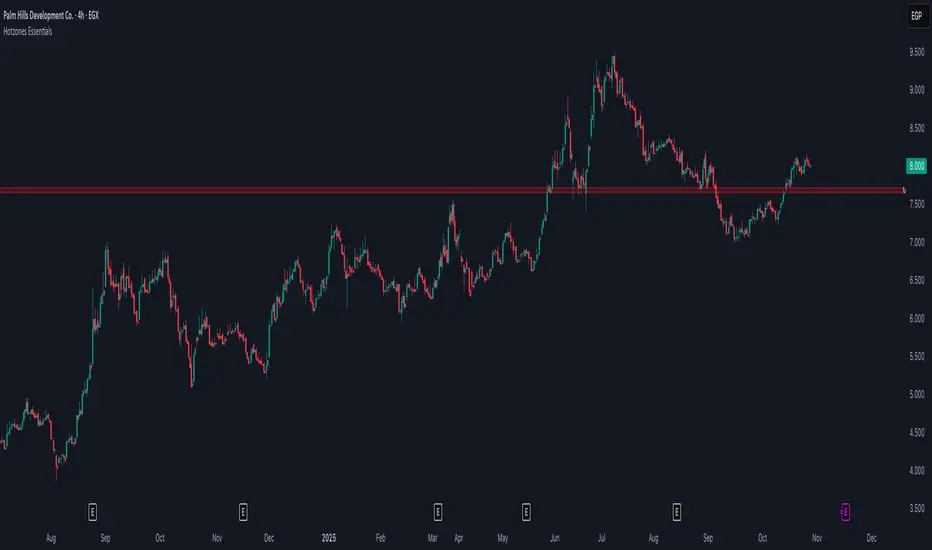
Killzone Levels
Killzone Levels expand on the concept of liquidity mapping by plotting the most influential horizontal levels in the market daily, weekly, and monthly highs and lows. These levels represent major liquidity pools where large clusters of stop orders, breakout triggers, and institutional re-entries often occur.
Users can customize every visual aspect of these levels, including color, style, and line thickness if needed.
These levels are crucial because markets tend to gravitate toward previous highs and lows to collect liquidity before reversing or extending the trend. Daily levels act as intraday targets, weekly levels provide swing and mid-term context, and monthly levels define macro liquidity boundaries where institutional flows are concentrated.
When a Killzone Block aligns with a Killzone Level; for example, a bullish block forming near a weekly low, it creates strong confluence and raises the probability of a meaningful reaction. Together, these levels transform simple horizontal lines into dynamic zones of opportunity.
Open Range Breakout
The Open Range Breakout feature identifies the first major liquidity window of each trading session, often referred to as the opening range or killzone window. This range is defined by the high and low formed within a user-defined session time (for example, 08:00–08:45 for the London session).
Shown above is a breakout of a range.
Once the window closes, the system locks in the session’s high and low, marking the balance point of early order flow. From this moment, price action is monitored in real time:
- A break above the high generates a bullish breakout signal, confirming buyer control.
- A break below the low generates a bearish breakout signal, confirming seller dominance.
To enhance accuracy, the feature includes a Level 2 Confirmation setting. Rather than triggering on a wick or brief spike, this level confirms a breakout only when a full candle closes outside the open range. This ensures signals reflect genuine intent and continuation pressure instead of short-term liquidity sweeps.
Seen above is confluence between a retest of a zone and a breakout.
Traders use the Open Range Breakout to establish session bias; whether the market is trending bullish or bearish for that specific session. Combined with Killzone Blocks and Levels, it forms a complete confluence system for identifying direction, gauging strength, and mapping high-probability reaction zones.
Overall this toolkit provides 3 unique tools that come together to form powerful confluence and deeper insights into volume and price action.
POC is added .
Minor fixes
Invite-only script
Only users approved by the author can access this script. You'll need to request and get permission to use it. This is typically granted after payment. For more details, follow the author's instructions below or contact ChartPrime directly.
TradingView does NOT recommend paying for or using a script unless you fully trust its author and understand how it works. You may also find free, open-source alternatives in our community scripts.
Author's instructions
Disclaimer
Invite-only script
Only users approved by the author can access this script. You'll need to request and get permission to use it. This is typically granted after payment. For more details, follow the author's instructions below or contact ChartPrime directly.
TradingView does NOT recommend paying for or using a script unless you fully trust its author and understand how it works. You may also find free, open-source alternatives in our community scripts.