dize Multi-Timeframe Power Index
the "Power Index" indicator is one part of our holistic approach to identifying trading setups. It is one of many indcators of our dize indicator package and should always be used in conjunction with the other dize indicators.
💡 What is the Power Index?
The "Power Index" indicator is our approach to measuring the volatility of an asset. It comes with multi-timeframe support, which helps to filter out bad trades. The indicator has a "Sensitivity" parameter that specifies how many historic candles should be looked at when calculating. The graph is a cloud colored according to historical volatility. This makes it possible to estimate at a glance how much risk and volatility currently prevail in the market.
💡How to use it?
By using the integrated settings you will be able to configure the power index for your market. Firstly, you should find the "Sensitivity" which best reflects your markets volatility. If you wish, you can also use the indicator on a different timeframe, than the one displayed on your chart. That can help to filter out noise and get a better perspective on what is happening on a bigger timeframe.
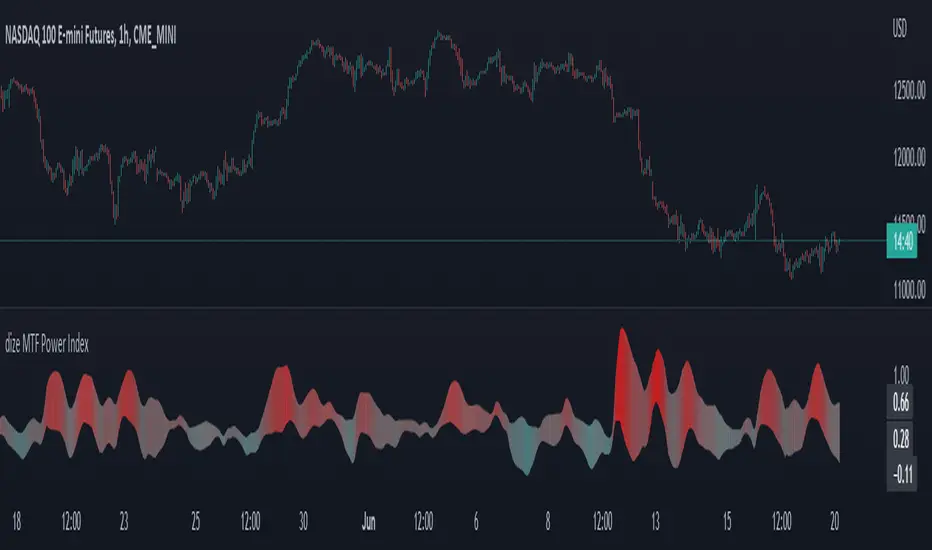
Let's have a look how we can use the Power Index to filter out noise on a lower timeframe:
In the above picture, both chart and power index run on the same timeframe. The Power Index calculates according to the selected timeframe and gives solid information.
If we zoom out on the power index by selecting a higher timeframe, we get the big picture and can easily identify low volatility, which might increase our chances on finding a good trading setup.
The above example is one of many use cases for the power index indicator.
🔓 To gain access to this indicator, please read the signature field.
Invite-only script
Only users approved by the author can access this script. You'll need to request and get permission to use it. This is typically granted after payment. For more details, follow the author's instructions below or contact paaax directly.
TradingView does NOT recommend paying for or using a script unless you fully trust its author and understand how it works. You may also find free, open-source alternatives in our community scripts.
Author's instructions
💰Save $30 on your Tradingview subscription: bit.ly/3OtLyNz
🔓Indicator access: dize-trading.de/
🔒Trial access: discord.gg/DqwKjBZ8Qe
Disclaimer
Invite-only script
Only users approved by the author can access this script. You'll need to request and get permission to use it. This is typically granted after payment. For more details, follow the author's instructions below or contact paaax directly.
TradingView does NOT recommend paying for or using a script unless you fully trust its author and understand how it works. You may also find free, open-source alternatives in our community scripts.
Author's instructions
💰Save $30 on your Tradingview subscription: bit.ly/3OtLyNz
🔓Indicator access: dize-trading.de/
🔒Trial access: discord.gg/DqwKjBZ8Qe