NQ Key Levels Map
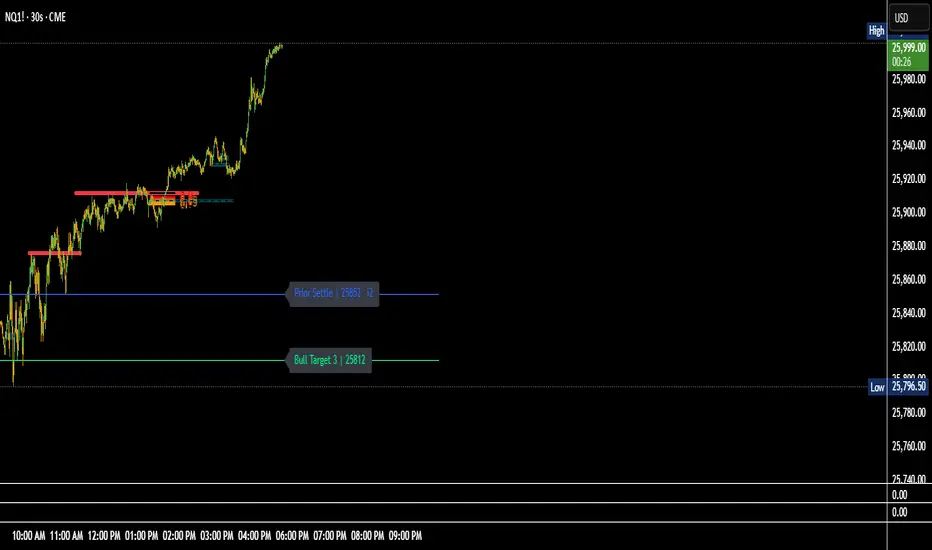
This indicator helps traders maintain spatial awareness of critical price zones throughout the session without cluttering the chart.
💡 Key Features:
🟩 Bullish Levels (Green)
Max ATM – highest key level or equilibrium pivot.
Bull Trigger – upside breakout or entry confirmation.
Bull Targets 1–3 – progressive profit targets for bullish continuation.
🟥 Bearish Levels (Red)
Min ATM – lowest key level or equilibrium pivot.
Bear Trigger – downside breakout or short confirmation.
Bear Targets 1–3 – progressive downside objectives.
Overnight Low – prior session low reference.
🟦 Contextual Levels (Blue)
Overnight High – prior session high reference.
Flip Area – inflection zone where sentiment can shift.
Prior Settle – yesterday’s settlement price anchor.
Invite-only script
Only users approved by the author can access this script. You'll need to request and get permission to use it. This is typically granted after payment. For more details, follow the author's instructions below or contact crptoworthy directly.
TradingView does NOT recommend paying for or using a script unless you fully trust its author and understand how it works. You may also find free, open-source alternatives in our community scripts.
Author's instructions
Disclaimer
Invite-only script
Only users approved by the author can access this script. You'll need to request and get permission to use it. This is typically granted after payment. For more details, follow the author's instructions below or contact crptoworthy directly.
TradingView does NOT recommend paying for or using a script unless you fully trust its author and understand how it works. You may also find free, open-source alternatives in our community scripts.