PROTECTED SOURCE SCRIPT
New York Probability Map NQ Lite [Herman]
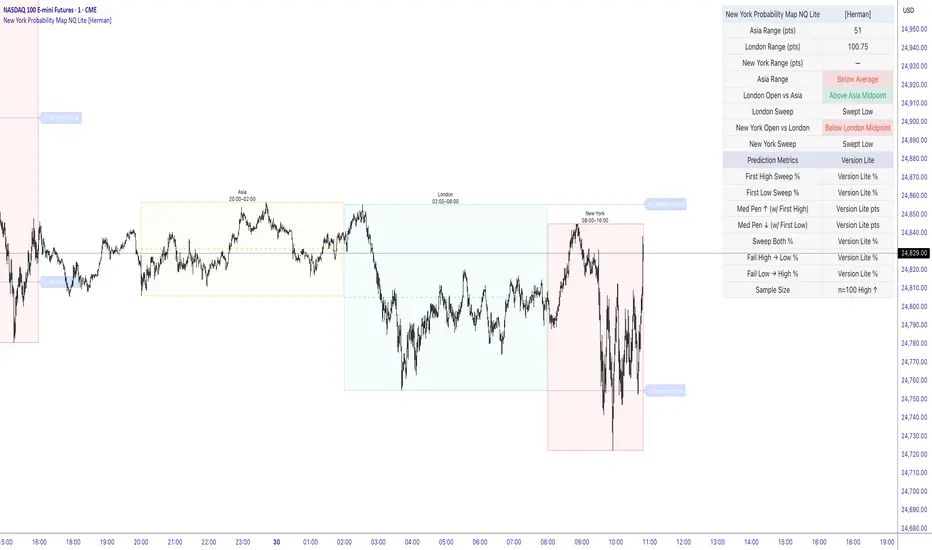
🇺🇸 NQ New York Probability Map LITE[Herman]
⚠️ IMPORTANT: This is the LITE (Free/Public) version of the NQ New York Probability Map indicator.
The Lite version offers the core visualization tools of the original indicator but intentionally excludes the proprietary statistical model. All probability metrics, such as "First Sweep %" and "Median Penetration (Med Pen)", are replaced with the label "Version Lite %" or "Version Lite pts" in the dashboard and on the price lines. This version is designed for general market session context and visual support only.
The original indicator features a built-in statistical model derived from over 10 years of historical backtesting across 72 contextual variants to provide precise probability estimates. This advanced data is NOT included in this Lite version.
📊 Indicator Overview
The NQ New York Probability Map Lite is a visual tool for NASDAQ 100 futures traders (NQ, MNQ) focusing on market structure, liquidity sweeps, and Asian/London session ranges, all filtered through an America/New_York (NY) timezone context.
It's designed to help traders identify the prior day's high/low points, which often serve as primary liquidity targets for the subsequent New York session.
✨ Key Features (Lite Version)
1. Global Session Visualization
Clearly demarcates the three primary trading sessions using color-coded boxes based on the New York timezone (EST/EDT):
🟡 Asia Session: 20:00 – 02:00 NY Time
🔵 London Session: 02:00 – 08:00 NY Time
🔴 New York Session: 08:00 – 16:00 NY Time (Full Session)
2. Contextual Dashboard
A dynamic dashboard provides essential market context and structural information:
Asia/London Range: Displays the actual point range of the prior sessions.
Midpoint Checks: Confirms whether the London Open price was above/below the Asia Midpoint, and if the New York Open price was above/below the London Midpoint.
London Sweep: Identifies if London swept the Asia High, Low, Both, or neither.
New York Sweep: Tracks if the NQ price has swept the London High, Low, or Both during the current New York session.
Sample Size (n): This is the only variable statistical data provided, indicating the number of historical days that match the current market's contextual setup (e.g., Asia Range size, Midpoint status). This helps you gauge the statistical relevance of the original model's context, even though the resulting data is masked.
3. Lite Prediction Lines
The indicator automatically projects lines representing the London Session High and London Session Low onto the New York session chart.
These lines serve as key liquidity targets.
In the Lite version, the associated probability labels display "Version Lite %" to avoid revealing the core statistical data. Both High and Low lines are drawn using neutral colors.
💡 How to Use the Lite Version
Use this Lite version primarily for visual context and structural awareness:
Identify Liquidity: The projected London High and Low lines are your primary liquidity targets for the New York session.
Analyze Context: Use the dashboard to quickly understand the current market narrative (e.g., "Asia Range: Below Average," "NY Open vs London: Above Midpoint").
Confirm Sweeps: Watch the "New York Sweep" metric to confirm if the market has already taken out one or both London liquidity pools.
Enjoy using the New York Probability Map Lite as a foundation for your session-based trading analysis!
Protected script
This script is published as closed-source. However, you can use it freely and without any limitations – learn more here.
Disclaimer
The information and publications are not meant to be, and do not constitute, financial, investment, trading, or other types of advice or recommendations supplied or endorsed by TradingView. Read more in the Terms of Use.