Magic Volume Oscillators PRO [MW] - Futures Strategy
STRATEGY SETTINGS
Start: The start day and time for the period being analyzed (Default: Jan 1, 2025, 8:30a)
End: The end day and time for the period being analyzed (Default: Jan 1, 2099, 5:30p)
US Regular Trading Hours: The time period that designates US trading hours (Default: 9:30a ET - 4p ET)
Use US Regular Trading Hours: Isolate signals so that they only occur during the defined US Regular Trading Hours (Default: OFF)
Use Long Positions: Show entry signals for long positions
Use Short Positions: Show entry signals for short positions
Trade Direction for Chart Display: Long and short signals use different configurations. This will show charts and signals specific to one direction or the other (Default: Long)
Stochastic Values - Long
- Volume - Stochastic Length: The stochastic length measurement for calculating stochastic volume (Default: 5)
- MACD or RSI - Stochastic Length: The stochastic length measurement for calculating stochastic MACD or stochastic RSI (Default: MACD 9)
- VWAP - Stochastic Length: The stochastic length measurement for calculating stochastic VWAP (Default:39)
For each of these, you can turn the line off by setting the “Line” dropdown to “None”. This will also turn off the corresponding “Signal Line” if that option is checked below under “Global Stochastic Settings”.
RSI Calculation Settings - Long
- RSI Length: The period for calculating the RSI
MACD Calculation Settings - Long
- Fast MA: The fast moving average (Default: 12)
- Slow MA: The slow moving average (Default: 26)
The stochastic values, RSI calculation, and MACD settings are repeated specifically, though, for short positions.
Global Stochastic Settings
- Smoothing: The level of smoothing used when building ALL stochastic calculations (Default: 3)
- Use Signal Lines: This will turn on the “Signal” lines for all line types: Volume, MACD, RSI, and VWAP for Long and Short trade directions (Default: OFF)
Visual Preferences
- Show Extended Hours Backgrounds: Green backgrounds are used when bullish conditions are present. Red backgrounds are used when bearish conditions are present. This option removes backgrounds that appear during extended hours - based on user specified US Regular Trading Hours (Default:OFF)
- Use Main Chart Background Also: Shows bullish and bearish backgrounds on the main chart in addition to the default backgrounds on the lower chart.
- Band Distance from 0 and 100: This creates the vertically centered band used on the background of the lower chart.
- Show Top and bottom Band: Shows a dashed line at the upper and lower band distance (Default: ON)
- Show Midline: Shows the middle line that centers the lower chart.
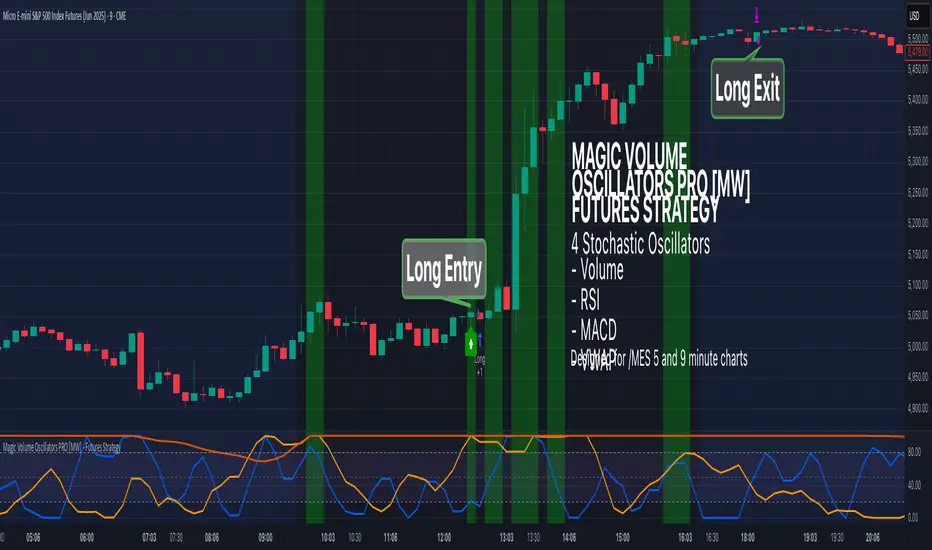
Stochastic volume chart with signal line and no background on the main chart
Stochastic volume, stochastic MACD, and stochastic VWAP with backgrounds on the main chart.
CALCULATIONS
This strategy makes use of standard volume, MACD, RSI, and daily VWAP values. It uses the ta.sma() and ta.stoch() native TradingView functions to calculate the stochastic values of volume, MACD, RSI, and daily VWAP.
The novel use of these calculations specifically for /MES futures is what sets this strategy apart. Because stochastic values provide a means to show regular, oscillating patterns, from noisy data, this strategy uses the stochastics to weed out low volume periods, emphasize price waves using RSI and MACD values, and define the preferred entry direction using VWAP.
HOW TO USE
Out of the box, this strategy has been optimized for /MESM2025 futures contracts during the period of 1/1/2025 to 5/15/2025 for the 5 minute and 9 minute timeframes. For /MES charts, you can select long position signals, short position signals, or both. It also uses alerts, so you can use TradingView’s native alerting features to send signals that have been triggered by the strategy. These signals can be used with webhooks to trigger orders for paper and live accounts.
The volume, MACD, RSI, and VWAP stochastic settings can be adjusted to refine the performance of the strategy in order for it to adapt to future /MES contracts. As well, MACD- and RSI-specific settings can be adjusted.
The background colors correspond to the Long position settings for the bullish green color, and the short position settings for the bearish red color. These help identify potential long and short position entries.
OTHER USAGE NOTES AND LIMITATIONS
The strategy can also be used purely as an indicator by turning off the Long and Short strategy directions by unchecking “Use Long Positions” and “Use Short Positions”. This will remove the “Long”, “Exit Long”, “Short”, and “Exit Short” messaging on the main chart. However, in order to use the alerts, those boxes need to stay checked while the alert is being set up.
Additionally, backgrounds that indicate long positions will turn off on the main chart when “Use Long Positions” is unchecked, as will all long signals and alerts. Likewise, backgrounds that indicate short positions will turn off on the main chart when “Use Short Positions” is unchecked, as will all short signals and alerts.
Also, as specified earlier, this strategy was optimized for /MES. It has not been tested on any other equities. That includes other futures products, stocks, FOREX, and crypto. If you find a configuration that works for anything other than /MES, please feel free to share it with the community.
It's important for traders to be aware of the limitations of any strategy or indicator and to use them as part of a broader, well-rounded trading strategy that includes risk management, fundamental analysis, and other tools that can help with reducing false signals, determining trend direction, and providing additional confirmation for a trade decision. Diversifying strategies and not relying solely on one type of indicator or analysis can help mitigate some of these risks.
- Added default long and short margin requirements of 0, to prevent no results from showing
- Added automated trading through Autoview and TradersPost for live and paper accounts
- Added position exiting when long and short signals overlap
- Added "Maximum Point Loss per Trade" user input to add a fixed stop
- Removed "calc_on_every_tick"
- Consolidated Autoview order strings so that they use the correct platform command for Tradovate
- Commented out logs
Invite-only script
Only users approved by the author can access this script. You'll need to request and get permission to use it. This is typically granted after payment. For more details, follow the author's instructions below or contact mwrightinc directly.
Note that this private, invite-only script has not been reviewed by script moderators, and its compliance with House Rules is undetermined. TradingView does NOT recommend paying for or using a script unless you fully trust its author and understand how it works. You may also find free, open-source alternatives in our community scripts.
Author's instructions
"Trading Advice for Losers" Email Newsletter
Disclaimer
Invite-only script
Only users approved by the author can access this script. You'll need to request and get permission to use it. This is typically granted after payment. For more details, follow the author's instructions below or contact mwrightinc directly.
Note that this private, invite-only script has not been reviewed by script moderators, and its compliance with House Rules is undetermined. TradingView does NOT recommend paying for or using a script unless you fully trust its author and understand how it works. You may also find free, open-source alternatives in our community scripts.
Author's instructions
"Trading Advice for Losers" Email Newsletter