OPEN-SOURCE SCRIPT
Updated Change% by Amit
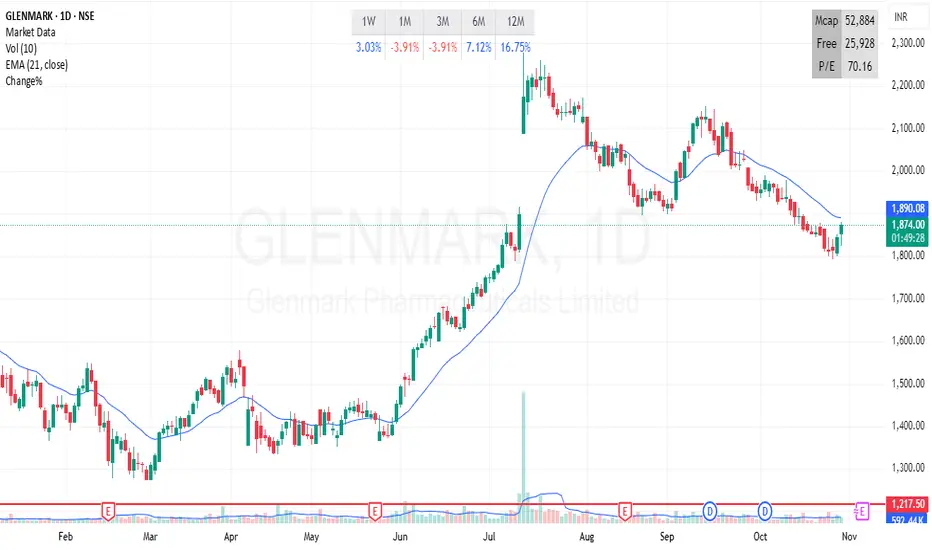
Multi-Period Returns Table
This indicator displays percentage returns across multiple timeframes —
1 Week,
1 Month,
3 Months,
6 Months,
12 Months.
This helps traders quickly assess short-term and long-term performance trends.
Positive returns are highlighted in blue, while negative returns are shown in red, allowing instant visual recognition of strength or weakness.
Ideal for spotting momentum shifts, relative performance, and trend consistency across different horizons.
Release Notes
Updated versionRelease Notes
Version 3Open-source script
In true TradingView spirit, the creator of this script has made it open-source, so that traders can review and verify its functionality. Kudos to the author! While you can use it for free, remember that republishing the code is subject to our House Rules.
Disclaimer
The information and publications are not meant to be, and do not constitute, financial, investment, trading, or other types of advice or recommendations supplied or endorsed by TradingView. Read more in the Terms of Use.
Open-source script
In true TradingView spirit, the creator of this script has made it open-source, so that traders can review and verify its functionality. Kudos to the author! While you can use it for free, remember that republishing the code is subject to our House Rules.
Disclaimer
The information and publications are not meant to be, and do not constitute, financial, investment, trading, or other types of advice or recommendations supplied or endorsed by TradingView. Read more in the Terms of Use.