OPEN-SOURCE SCRIPT
Updated Support and Resistance with Signals [UAlgo]
🔶 Description:
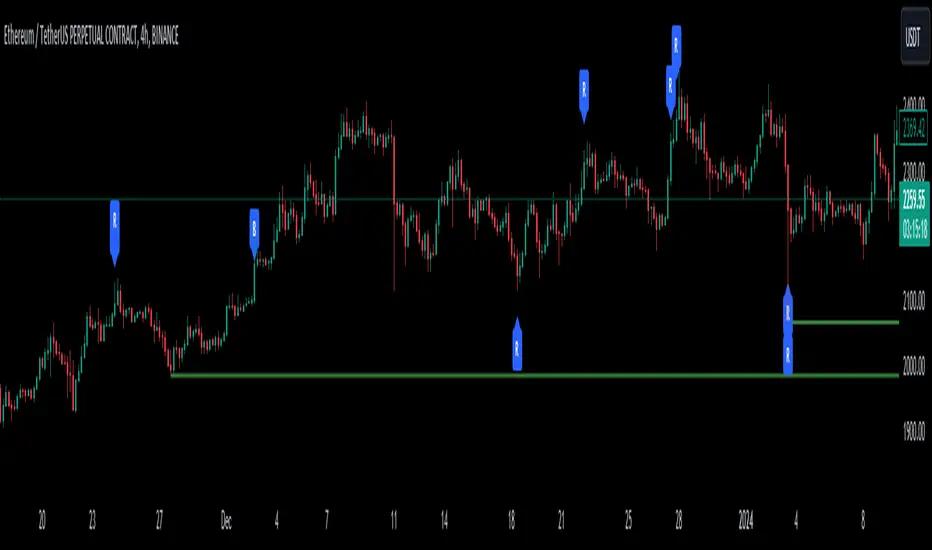
"Support and Resistance with Signals [UAlgo]", is designed to identify key support and resistance levels on a trading chart while also signaling potential retests (denoted as "R") and breakouts (denoted as "B"). The indicator dynamically plots support and resistance lines based on pivot points and adjusts them according to price action and sensitivity settings. It aims to assist traders in identifying significant price levels and potential reversal or breakout opportunities.
🔶 Key Features:
Pivot Points: The indicator calculates pivot highs and pivot lows based on a specified period length (Checks Left and Right bars). Adjust the length of the pivot period to control the sensitivity of support and resistance levels according to the your preferences.
Support and Resistance Lines: It plots support and resistance lines at the pivot high and pivot low points, respectively.
Retest and Breakout Signals: Signals are generated based on the sensitivity setting, which adds/subtracts a portion (half) of the Average True Range (ATR) to the pivot points. A retest signal ("R") is generated when the price approaches the support or resistance level within the sensitivity range. A breakout signal ("B") is generated when the price surpasses the support or resistance level.

Sensitivity (ATR Length): Modify the retest-breakout sensitivity length to fine-tune the generation of signals based on price volatility.
Maximum Lines: Limit the number of support and resistance lines displayed on the chart for clarity.
Line Colors and Width: Customize the colors and width of support and resistance lines for better visualization.
More Examples:
Before Retest Signal:

When the price enters the retest range at the specified sensitivity:

Disclaimer:
This indicator is provided for informational purposes only and should not be considered as financial advice. Trading involves risk, and users should conduct their own research and analysis before making any investment decisions. The retest and breakout signals generated by this indicator are based on historical price data and may not guarantee future results. Users should exercise caution and use additional confirmation methods before entering any trades based on the signals provided by this indicator.
Happy Trading !
"Support and Resistance with Signals [UAlgo]", is designed to identify key support and resistance levels on a trading chart while also signaling potential retests (denoted as "R") and breakouts (denoted as "B"). The indicator dynamically plots support and resistance lines based on pivot points and adjusts them according to price action and sensitivity settings. It aims to assist traders in identifying significant price levels and potential reversal or breakout opportunities.
🔶 Key Features:
Pivot Points: The indicator calculates pivot highs and pivot lows based on a specified period length (Checks Left and Right bars). Adjust the length of the pivot period to control the sensitivity of support and resistance levels according to the your preferences.
Support and Resistance Lines: It plots support and resistance lines at the pivot high and pivot low points, respectively.
Retest and Breakout Signals: Signals are generated based on the sensitivity setting, which adds/subtracts a portion (half) of the Average True Range (ATR) to the pivot points. A retest signal ("R") is generated when the price approaches the support or resistance level within the sensitivity range. A breakout signal ("B") is generated when the price surpasses the support or resistance level.
Sensitivity (ATR Length): Modify the retest-breakout sensitivity length to fine-tune the generation of signals based on price volatility.
Maximum Lines: Limit the number of support and resistance lines displayed on the chart for clarity.
Line Colors and Width: Customize the colors and width of support and resistance lines for better visualization.
More Examples:
Before Retest Signal:
When the price enters the retest range at the specified sensitivity:
Disclaimer:
This indicator is provided for informational purposes only and should not be considered as financial advice. Trading involves risk, and users should conduct their own research and analysis before making any investment decisions. The retest and breakout signals generated by this indicator are based on historical price data and may not guarantee future results. Users should exercise caution and use additional confirmation methods before entering any trades based on the signals provided by this indicator.
Happy Trading !
Release Notes
chart updateRelease Notes
Pinescript version update.Open-source script
In true TradingView spirit, the creator of this script has made it open-source, so that traders can review and verify its functionality. Kudos to the author! While you can use it for free, remember that republishing the code is subject to our House Rules.
Disclaimer
The information and publications are not meant to be, and do not constitute, financial, investment, trading, or other types of advice or recommendations supplied or endorsed by TradingView. Read more in the Terms of Use.
Open-source script
In true TradingView spirit, the creator of this script has made it open-source, so that traders can review and verify its functionality. Kudos to the author! While you can use it for free, remember that republishing the code is subject to our House Rules.
Disclaimer
The information and publications are not meant to be, and do not constitute, financial, investment, trading, or other types of advice or recommendations supplied or endorsed by TradingView. Read more in the Terms of Use.