OPEN-SOURCE SCRIPT
Updated Buying Opportunity Score V2.1
Overview
A composite scoring system (0-100) that identifies high-probability buying opportunities during market pullbacks. Validated through backtesting on SPY from 2010-2024.
How It Works
The indicator combines multiple fear and oversold signals into a single actionable score. When fear is elevated and the market is oversold, the score rises. Higher scores historically correlate with better forward returns.
Scoring Components
VIX Level (30 pts) - Market fear gauge
Drawdown (30 pts) - Distance from 52-week high
RSI 14 (12 pts) - Oversold confirmation
Bollinger Band (13 pts) - Statistical extreme
VIX Timing (15 pts) - Bonus when VIX declining from peak
Signal Levels
80+ = STRONG BUY (high conviction)
70-79 = BUY (consider entry)
60-69 = WATCH (monitor closely)
Below 60 = No signal
Backtest Results (SPY, 2010-2024)
70+ Signals: 85% win rate, 7.5% average 20-day return
80+ Signals: 100% win rate, 14% average 20-day return
Features
Statistics table showing 1Y, 3Y, 5Y rolling performance
Signal markers (green triangles) on buy signals
Outcome labels showing WIN/LOSS after measurement period
Multiple alert options
Works on SPY, QQQ, IWM (use VIX for all)
How To Use
Add to SPY, QQQ, or IWM (daily timeframe)
Wait for score to reach 70+ or 80+
Green triangle marks signal day
Check statistics table for recent performance
Set alerts for notifications
Alerts Available
STRONG BUY Signal (80+)
BUY Signal (70+)
Moderate Signal (60+)
Score Crossed 80/70
Score Dropped Below 70
Important Notes
Designed for daily timeframe on broad market ETFs
Signals confirm at end of day (bar close)
Statistics table shows rolling windows based on loaded data
Past performance does not guarantee future results
Release Notes
Overview:A composite scoring system (0-100) that identifies high-probability buying opportunities during market pullbacks. Validated through backtesting on SPY from 2010-2024.
How It Works
The indicator combines multiple fear and oversold signals into a single actionable score. When fear is elevated and the market is oversold, the score rises. Higher scores historically correlate with better forward returns.
Scoring Components
VIX Level (30 pts) - Market fear gauge
Drawdown (30 pts) - Distance from 52-week high
RSI 14 (12 pts) - Oversold confirmation
Bollinger Band (13 pts) - Statistical extreme
VIX Timing (15 pts) - Bonus when VIX declining from peak
Signal Levels
80+ = STRONG BUY (high conviction)
70-79 = BUY (consider entry)
60-69 = WATCH (monitor closely)
Below 60 = No signal
Backtest Results (SPY, 2010-2024)
70+ Signals: 85% win rate, 7.5% average 20-day return
80+ Signals: 100% win rate, 14% average 20-day return
Features
Statistics table showing 1Y, 3Y, 5Y rolling performance
Signal markers (green triangles) on buy signals
Outcome labels showing WIN/LOSS after measurement period
Multiple alert options
Works on SPY, QQQ, IWM (use VIX for all)
How To Use
Add to SPY, QQQ, or IWM (daily timeframe)
Wait for score to reach 70+ or 80+
Green triangle marks signal day
Check statistics table for recent performance
Set alerts for notifications
Alerts Available
STRONG BUY Signal (80+)
BUY Signal (70+)
Moderate Signal (60+)
Score Crossed 80/70
Score Dropped Below 70
Important Notes
Designed for daily timeframe on broad market ETFs
Signals confirm at end of day (bar close)
Statistics table shows rolling windows based on loaded data
Past performance does not guarantee future results
Release Notes
OverviewA composite scoring system (0-100) that identifies high-probability buying opportunities during market pullbacks. Validated through backtesting on SPY from 2010-2024.
How It Works
The indicator combines multiple fear and oversold signals into a single actionable score. When fear is elevated and the market is oversold, the score rises. Higher scores historically correlate with better forward returns.
Scoring Components
VIX Level (30 pts) - Market fear gauge
Drawdown (30 pts) - Distance from 52-week high
RSI 14 (12 pts) - Oversold confirmation
Bollinger Band (13 pts) - Statistical extreme
VIX Timing (15 pts) - Bonus when VIX declining from peak
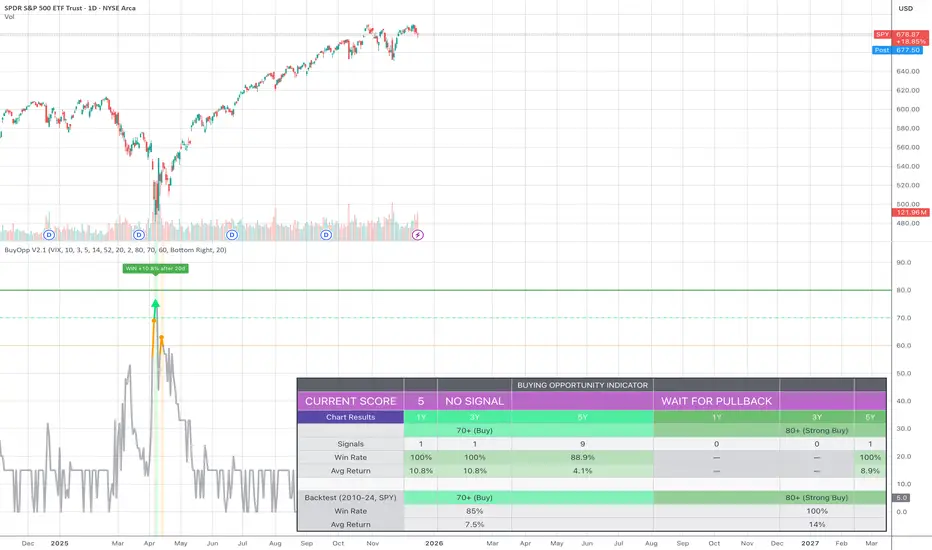
Current Score
The table displays your live score (0-100) with context:
0-29 = WAIT FOR PULLBACK - Market calm, no opportunity
30-49 = NOT ACTIONABLE - Mild stress
50-59 = MONITOR - Fear rising
60-69 = WATCH - Potential entry soon
70-79 = BUY - Consider entering
80+ = STRONG BUY - High conviction entry
Signal Levels
80+ = STRONG BUY (high conviction)
70-79 = BUY (consider entry)
60-69 = WATCH (monitor closely)
Below 60 = No signal
Backtest Results (SPY, 2010-2024)
70+ Signals: 85% win rate, 7.5% average 20-day return
80+ Signals: 100% win rate, 14% average 20-day return
Features
Statistics table showing 1Y, 3Y, 5Y rolling performance
Signal markers (green triangles) on buy signals
Outcome labels showing WIN/LOSS result after 20 days
Multiple alert options
Works on SPY, QQQ, IWM (use VIX for all)
How To Use
Add to SPY, QQQ, or IWM (daily timeframe)
Check the CURRENT SCORE row for today's reading
Wait for score to reach 70+ or 80+
Green triangle marks signal day
Set alerts for notifications
Alerts Available
STRONG BUY Signal (80+)
BUY Signal (70+)
Moderate Signal (60+)
Score Crossed 80/70
Score Dropped Below 70
Important Notes
Designed for daily timeframe on broad market ETFs
Signals confirm at end of day (bar close)
Chart Results show rolling 1Y/3Y/5Y performance from loaded data
Backtest row shows validated 2010-2024 SPY results
Past performance does not guarantee future results
Open-source script
In true TradingView spirit, the creator of this script has made it open-source, so that traders can review and verify its functionality. Kudos to the author! While you can use it for free, remember that republishing the code is subject to our House Rules.
Disclaimer
The information and publications are not meant to be, and do not constitute, financial, investment, trading, or other types of advice or recommendations supplied or endorsed by TradingView. Read more in the Terms of Use.