RSI Overbought, Oversold and over/under midline
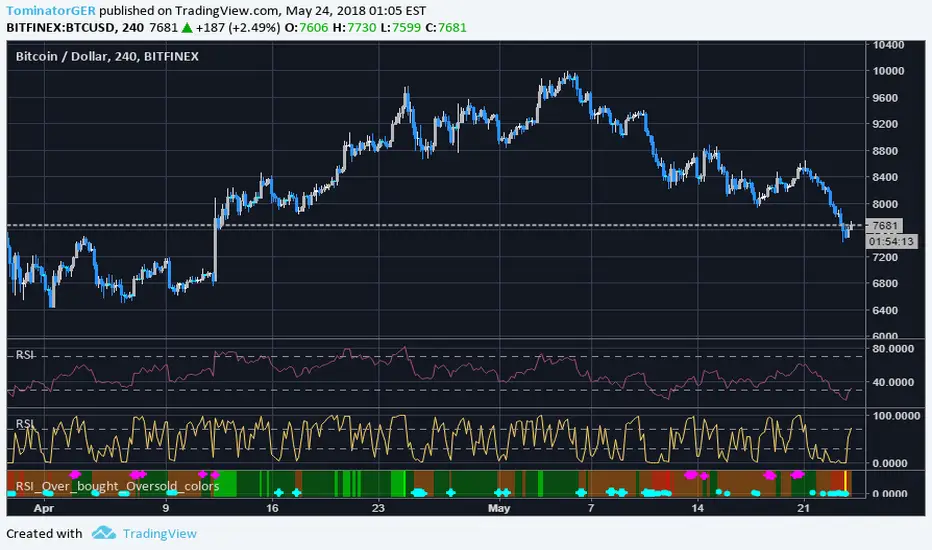
- Circles = RSI 2 period is in overbought /-sold -> Weaker buy / sell signal
- Cross = RSI 2 period is in overbought /-sold + price is above MA200 + below MA5 -> stronger buy / sell entry signal
- brown / dark green background = RSI 14 over or under midline -> Indicates bullish / bearisch momentum
- light red / green background = RSI 14 over 70 or under 30 -> Normal RSI overbought /-sold state
- red / bright green background = RSI 14 over 80 or under 20 -> Stronger RSI overbought /-sold state
- yellow background = RSI 14 over / under the 52 week high / low -> Very strong RSI overbought /-sold state
The indicator is designed to work on multiple chart layouts and smaller screens where you would not see the exact RSI states in the normal RSI indicator. You can also identify the RSI state very quick and it saves you space because you can identify the states even if the indicator window is very small.
Please give feedback in the comments what you think and what you would do better.
For access please leave a comment.
Invite-only script
Only users approved by the author can access this script. You'll need to request and get permission to use it. This is typically granted after payment. For more details, follow the author's instructions below or contact TominatorGER directly.
TradingView does NOT recommend paying for or using a script unless you fully trust its author and understand how it works. You may also find free, open-source alternatives in our community scripts.
Author's instructions
Disclaimer
Invite-only script
Only users approved by the author can access this script. You'll need to request and get permission to use it. This is typically granted after payment. For more details, follow the author's instructions below or contact TominatorGER directly.
TradingView does NOT recommend paying for or using a script unless you fully trust its author and understand how it works. You may also find free, open-source alternatives in our community scripts.