OPEN-SOURCE SCRIPT
Momentum Candle Identifier
# Momentum Candle Identifier
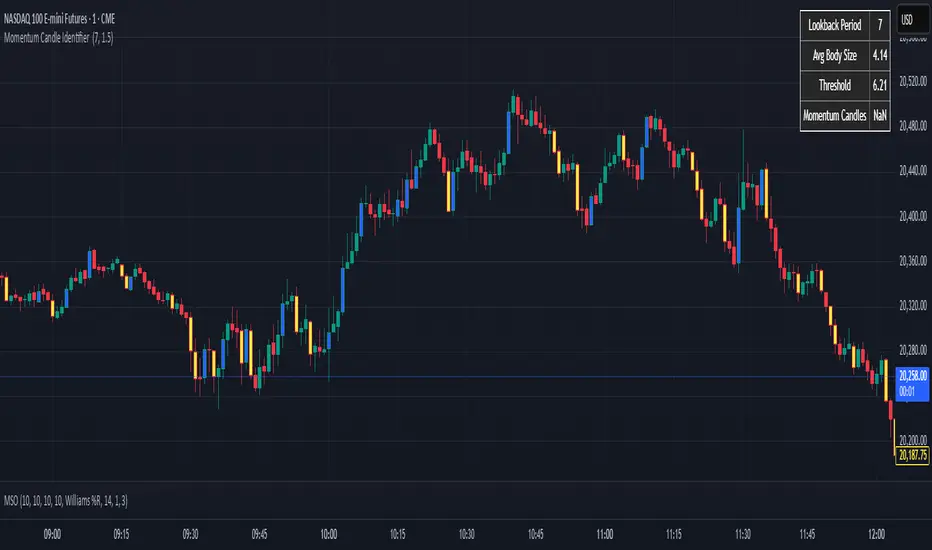
This indicator helps traders identify significant momentum candles by analyzing candle body size relative to recent price action (think after consolidation periods). Unlike traditional volatility indicators, this tool specifically focuses on price movement captured by the candle body (open to close distance), filtering out potentially misleading wicks.
## How It Works
- The indicator calculates the average candle body size over a user-defined lookback period
- Momentum candles are identified when their body size exceeds the average by a customizable threshold multiplier
- Bullish momentum candles (close > open) are highlighted in a user defined color
- Bearish momentum candles (close < open) are highlighted in a user defined color
- A real-time information panel displays key metrics including current average body size and threshold values
## Key Features
- Focus on candle body size rather than full range (high to low)
- Custom lookback period to adapt to different timeframes
- Adjustable threshold multiplier to fine-tune sensitivity
- Customizable colors for bullish and bearish momentum candles
- Optional labels for momentum candles
- Information panel showing lookback settings, average size, and momentum candle count
## Usage Tips
- Use shorter lookback periods (3-5) for more signals in choppy markets
- Use longer lookback periods (8-20) to identify only the most significant momentum moves
- Higher threshold multipliers (2.0+) will identify only the strongest momentum candles
- Combine with trend indicators to find potential reversal or continuation signals
- Look for clusters of momentum candles to identify strong shifts in market sentiment
This indicator helps identify candles that represent significant price movement relative to recent activity, potentially signaling changes in market momentum, sentiment shifts, or the beginning of new trends.
Open-source script
In true TradingView spirit, the creator of this script has made it open-source, so that traders can review and verify its functionality. Kudos to the author! While you can use it for free, remember that republishing the code is subject to our House Rules.
Disclaimer
The information and publications are not meant to be, and do not constitute, financial, investment, trading, or other types of advice or recommendations supplied or endorsed by TradingView. Read more in the Terms of Use.