OPEN-SOURCE SCRIPT
Updated Correlations P/L Range (in percent)
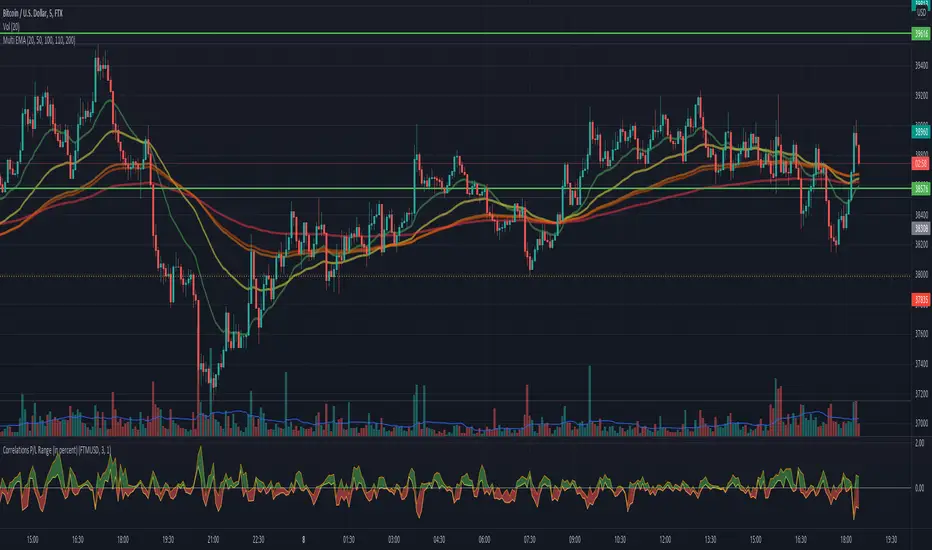
This script shows the inefficiency of the markets.
Comparing two (correlated) symbols, the values above 0 means the main symbol (at the top of the graph)
outperforms the other. A value below 0 means the main symbol underperforms the other.
The band displays different entries until the last candle. Any P/L (of the band range)
is visible in the band. Example: given a band range length of 5, then all last 5 values
are compares with the current value for both symbols. Or in other words:
If symbol A, lets say ETHUSD outperforms, lets say BITCOIN (the main symbol), in the last
5 candles, then we would see all values of the band are negative.
Any question, comment or improvements are welcome.
Release Notes
see description of the scriptOpen-source script
In true TradingView spirit, the creator of this script has made it open-source, so that traders can review and verify its functionality. Kudos to the author! While you can use it for free, remember that republishing the code is subject to our House Rules.
Disclaimer
The information and publications are not meant to be, and do not constitute, financial, investment, trading, or other types of advice or recommendations supplied or endorsed by TradingView. Read more in the Terms of Use.
Open-source script
In true TradingView spirit, the creator of this script has made it open-source, so that traders can review and verify its functionality. Kudos to the author! While you can use it for free, remember that republishing the code is subject to our House Rules.
Disclaimer
The information and publications are not meant to be, and do not constitute, financial, investment, trading, or other types of advice or recommendations supplied or endorsed by TradingView. Read more in the Terms of Use.