OPEN-SOURCE SCRIPT
Updated 52WH/last52WHbefore3Months/ATH
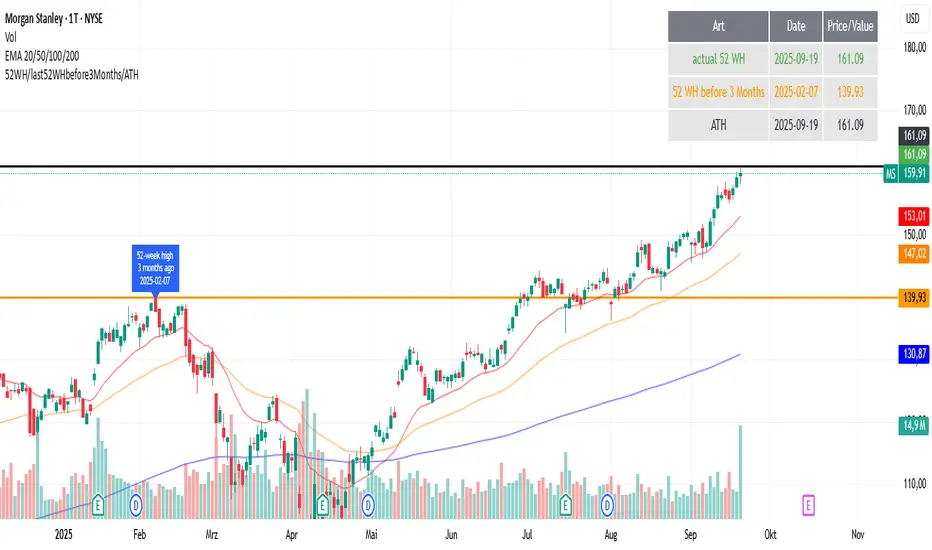
This indicator calculates and displays three values:
First, it calculates the current 52-week high and displays it as a line and in a table at the top right with the name, date, and price.
Corresponding color markings are also displayed on the price scale.
Next, the 52-week high that is at least three months ago is determined.
The corresponding candle is also labeled with a date. This past high is also displayed as a line, on the price scale, and in the table.
Finally, the current all-time high is determined and also displayed as a line, in the price scale, and in the table.
All display values can be turned on or off in the view, and the corresponding colors of the displays can also be freely selected.
(This script was developed by J. Heina, jochen.heina(at)gmail, in collaboration with the ChatGPT tool).
=====
Release Notes
This indicator calculates and displays three values:First, it calculates the current 52-week high and displays it as a line and in a table at the top right with the name, date, and price.
Corresponding color markings are also displayed on the price scale.
Next, the 52-week high that is at least three months ago is determined.
The corresponding candle is also labeled with a date. This past high is also displayed as a line, on the price scale, and in the table.
Finally, the current all-time high is determined and also displayed as a line, in the price scale, and in the table.
All display values can be turned on or off in the view, and the corresponding colors of the displays can also be freely selected.
(This script was developed by J. Heina, jochen.heinaGmail, in collaboration with the ChatGPT tool).
=====
Release Notes
This indicator calculates and displays three values:First, it calculates the current 52-week high and displays it as a line and in a table at the top right with the name, date, and price.
Corresponding color markings are also displayed on the price scale.
Next, the 52-week high that is at least three months ago is determined.
The corresponding candle is also labeled with a date. This past high is also displayed as a line, on the price scale, and in the table.
Finally, the current all-time high is determined and also displayed as a line, in the price scale, and in the table.
All display values can be turned on or off in the view, and the corresponding colors of the displays can also be freely selected.
(This script was developed by J. Heina, jochen.heina(at)gmail, in collaboration with the ChatGPT tool).
=====
Open-source script
In true TradingView spirit, the creator of this script has made it open-source, so that traders can review and verify its functionality. Kudos to the author! While you can use it for free, remember that republishing the code is subject to our House Rules.
Disclaimer
The information and publications are not meant to be, and do not constitute, financial, investment, trading, or other types of advice or recommendations supplied or endorsed by TradingView. Read more in the Terms of Use.