PROTECTED SOURCE SCRIPT
Updated Hopiplaka Twin Tower Levels (Variable Multiplier) [NZA 333]
Purpose
Instrument scope: This indicator is for exchange-traded futures only (e.g., CME/ICE). It assumes a regular session with a 16:00 daily fix; use on spot FX, equities/ETFs, CFDs, or crypto is not supported and may produce incorrect windows/levels.
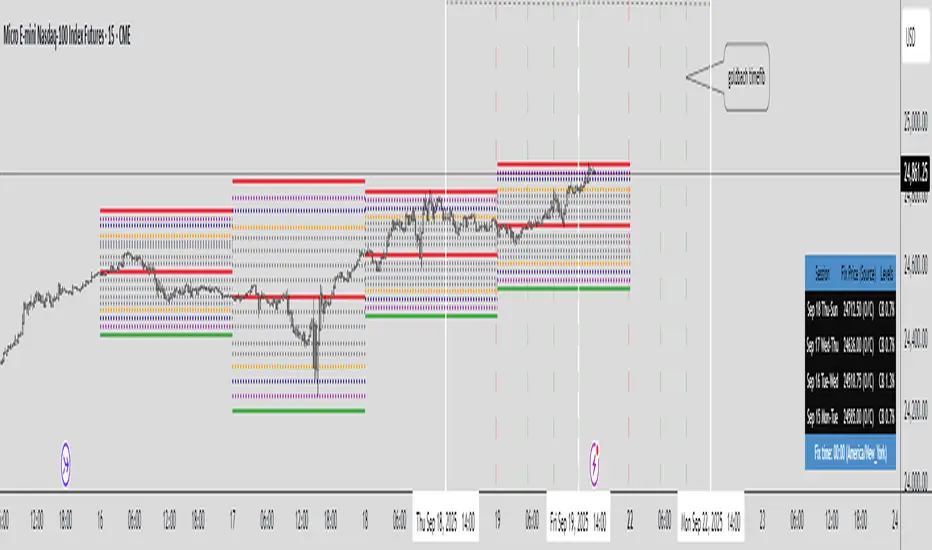
This tool draws structured possible support/resistance price-level frameworks anchored to a daily “Fix” at 16:00 and lets you study intraday expansion/mean-reversion from that anchor. It overlays three families of levels:
CB - Circuit-Breaker style bands: symmetric bands at ±X% of the Fix (user-defined), plus intermediate percentages (14/26/40/50/60/74/86) and three highlighted “impulse” bands.
GB – “Goldbach-type” ratios: fixed ratios applied to a user-selected PO3 dealing range (e.g., 729, 2187, 6561 points). This produces low/eq/high rails and intermediate harmonics, including extended rails at −0.111 and 1.111.
STDV – “Stop-Run” ladders: equidistant steps (user step size) centered on the Fix and bounded by ±PO3/2.
All drawings are time-boxed windows that run from one 16:00 to the next 16:00 so you can compare today vs. prior sessions at a glance, including weekends/market closures.
How it works (high level)
Session windows (16:00→16:00)
For non-crypto symbols, each “day” is a window starting at 16:00 in the user-chosen timezone (default: America/New_York) and ending at the next day’s 15:59. When a new 16:00 occurs, the script immediately rolls the windows forward so Day-0, Day-1, Day-2, Day-3 always reference the latest four 16:00 anchors, even across weekends.
Fix source (per day)
Each day can use one of:
O/C: the open price of the 16:00 bar (acts as an official fix for that session).
VWAP: the VWAP value on the 15:59:30 (last 30 seconds bar before 16:00). You need Trading View Premium to use this source.
Manual: user-entered value. You can visit CME Group's website to see the published fix prices for your chart and enter it manually.
For a current session you want to use the previous session fix price until 4 pm (New York).
Market type handling
Crypto: by default the Fix is 16:00 Europe/London (configurable). Crypto session handling remains continuous; the script keeps the crypto branch behavior separate so nothing changes for 24/7 markets.
Non-crypto: uses the selected timezone (default NY). The script explicitly handles weekends/holidays so Day-0 can be Fri→Mon and Day-1 Thu→Fri, etc.
Ratios & math
Circuit Breakers bands: Fix ± (Fix * percent / 100), with extra mid-points (“CE levels”) and the intermediate percentages listed above.
Goldbach ratios: a fixed array of ratios mapped onto the PO3 distance; on Forex, PO3 is automatically converted to price units using syminfo.mintick.
STDV steps: Fix ± n * step, drawn only within ±PO3/2.
Rendering model
Lines are created with xloc = xloc.bar_time between the window’s start/end timestamps. A housekeeping buffer deletes/redraws on the last bar to keep charts responsive when you toggle features. A compact table shows, per day window, the session label, Fix (and its source), and the active options (CB%, PO3, STDV).
Update behavior
As soon as the 16:00 1-minute bar closes, the Fix for Day-0 updates and older windows roll forward. Historical windows (Day-1/2/3) also move forward afterward, since their Fix times are already stored. On higher timeframes, the script relies on the captured 1-minute Fix so Day-0 levels appear intrabar even if the higher-TF candle hasn’t closed yet.
How to use it
I - Choose the Fix source per day (Manual / VWAP / O/C).
II- Choose levels to show on each day, via toggles:
- Mode 1: Toggle "Show Goldbach Levels" and/or "NG Levels" / "CE Levels" (extra ratio sets) to show these levels for the day. Choose PO3 DR (Dealing Range), note the fix price acts as Equilibrium.
- Mode 2: Toggle "Show Stop Run Levels" to show PO3 distance in handles from Fix Price. Choose a PO3 number from the "STDV" option, this will be your max distance in handles (think Dealing Range).
- Mode 3: Toggle "Show Circuit Breaker Levels" to show ratios derived from the CME Group's official price limits percents from the fix price for a day (7%, 13% or 20%) * 2.
Each mode's toggles are in the same line, one line per mode. Usually you just need one of the 3 modes.
III - Use Day shift to scroll the four windows through past sessions (0 by default).
IV - Use Hour shift to visually nudge the drawings on the time axis without changing calculations.
Timezone: for non-crypto, select America/New_York, Europe/London or UTC for the 16:00 anchor. Crypto can auto-use London 16:00.
Notes & limitations
The tool does not generate buy/sell signals; it’s a visual framework for contextual levels.
O/C fixes (Default) are captured from the 1-minute series at exactly 16:00; if a symbol lacks 1-minute history at that time (rare), a day window may show as missing or could take the fix price incorrectly.
VWAP fixes are captured from the 30-seconds series at exactly 16:00; if a symbol lacks 30 seconds history at that time, a day window may show as missing.
Historical windows are fixed once their 16:00 bar has closed; Day-0 updates only at the moment a new 16:00 occurs.
Be mindful of symbol tick size/PO3 scale on Forex vs. indices/futures.
This indicator does not predict future values and does not access future data beyond the last completed 16:00 bar. See TradingView’s guidance on realistic claims and use of request.security.
(Educational use only. Trading involves risk; past behavior of levels relative to price does not guarantee future outcomes.)
Instrument scope: This indicator is for exchange-traded futures only (e.g., CME/ICE). It assumes a regular session with a 16:00 daily fix; use on spot FX, equities/ETFs, CFDs, or crypto is not supported and may produce incorrect windows/levels.
This tool draws structured possible support/resistance price-level frameworks anchored to a daily “Fix” at 16:00 and lets you study intraday expansion/mean-reversion from that anchor. It overlays three families of levels:
CB - Circuit-Breaker style bands: symmetric bands at ±X% of the Fix (user-defined), plus intermediate percentages (14/26/40/50/60/74/86) and three highlighted “impulse” bands.
GB – “Goldbach-type” ratios: fixed ratios applied to a user-selected PO3 dealing range (e.g., 729, 2187, 6561 points). This produces low/eq/high rails and intermediate harmonics, including extended rails at −0.111 and 1.111.
STDV – “Stop-Run” ladders: equidistant steps (user step size) centered on the Fix and bounded by ±PO3/2.
All drawings are time-boxed windows that run from one 16:00 to the next 16:00 so you can compare today vs. prior sessions at a glance, including weekends/market closures.
How it works (high level)
Session windows (16:00→16:00)
For non-crypto symbols, each “day” is a window starting at 16:00 in the user-chosen timezone (default: America/New_York) and ending at the next day’s 15:59. When a new 16:00 occurs, the script immediately rolls the windows forward so Day-0, Day-1, Day-2, Day-3 always reference the latest four 16:00 anchors, even across weekends.
Fix source (per day)
Each day can use one of:
O/C: the open price of the 16:00 bar (acts as an official fix for that session).
VWAP: the VWAP value on the 15:59:30 (last 30 seconds bar before 16:00). You need Trading View Premium to use this source.
Manual: user-entered value. You can visit CME Group's website to see the published fix prices for your chart and enter it manually.
For a current session you want to use the previous session fix price until 4 pm (New York).
Market type handling
Crypto: by default the Fix is 16:00 Europe/London (configurable). Crypto session handling remains continuous; the script keeps the crypto branch behavior separate so nothing changes for 24/7 markets.
Non-crypto: uses the selected timezone (default NY). The script explicitly handles weekends/holidays so Day-0 can be Fri→Mon and Day-1 Thu→Fri, etc.
Ratios & math
Circuit Breakers bands: Fix ± (Fix * percent / 100), with extra mid-points (“CE levels”) and the intermediate percentages listed above.
Goldbach ratios: a fixed array of ratios mapped onto the PO3 distance; on Forex, PO3 is automatically converted to price units using syminfo.mintick.
STDV steps: Fix ± n * step, drawn only within ±PO3/2.
Rendering model
Lines are created with xloc = xloc.bar_time between the window’s start/end timestamps. A housekeeping buffer deletes/redraws on the last bar to keep charts responsive when you toggle features. A compact table shows, per day window, the session label, Fix (and its source), and the active options (CB%, PO3, STDV).
Update behavior
As soon as the 16:00 1-minute bar closes, the Fix for Day-0 updates and older windows roll forward. Historical windows (Day-1/2/3) also move forward afterward, since their Fix times are already stored. On higher timeframes, the script relies on the captured 1-minute Fix so Day-0 levels appear intrabar even if the higher-TF candle hasn’t closed yet.
How to use it
I - Choose the Fix source per day (Manual / VWAP / O/C).
II- Choose levels to show on each day, via toggles:
- Mode 1: Toggle "Show Goldbach Levels" and/or "NG Levels" / "CE Levels" (extra ratio sets) to show these levels for the day. Choose PO3 DR (Dealing Range), note the fix price acts as Equilibrium.
- Mode 2: Toggle "Show Stop Run Levels" to show PO3 distance in handles from Fix Price. Choose a PO3 number from the "STDV" option, this will be your max distance in handles (think Dealing Range).
- Mode 3: Toggle "Show Circuit Breaker Levels" to show ratios derived from the CME Group's official price limits percents from the fix price for a day (7%, 13% or 20%) * 2.
Each mode's toggles are in the same line, one line per mode. Usually you just need one of the 3 modes.
III - Use Day shift to scroll the four windows through past sessions (0 by default).
IV - Use Hour shift to visually nudge the drawings on the time axis without changing calculations.
Timezone: for non-crypto, select America/New_York, Europe/London or UTC for the 16:00 anchor. Crypto can auto-use London 16:00.
Notes & limitations
The tool does not generate buy/sell signals; it’s a visual framework for contextual levels.
O/C fixes (Default) are captured from the 1-minute series at exactly 16:00; if a symbol lacks 1-minute history at that time (rare), a day window may show as missing or could take the fix price incorrectly.
VWAP fixes are captured from the 30-seconds series at exactly 16:00; if a symbol lacks 30 seconds history at that time, a day window may show as missing.
Historical windows are fixed once their 16:00 bar has closed; Day-0 updates only at the moment a new 16:00 occurs.
Be mindful of symbol tick size/PO3 scale on Forex vs. indices/futures.
This indicator does not predict future values and does not access future data beyond the last completed 16:00 bar. See TradingView’s guidance on realistic claims and use of request.security.
(Educational use only. Trading involves risk; past behavior of levels relative to price does not guarantee future outcomes.)
Release Notes
* Variable fix time (settlement) added.Release Notes
* Fix time settings updated: now you can choose the time and the timezone for the automatic fix price feature. Different future instruments have different settlement times, now you can study Gold futures or BTC futures for example. Also you can experiment with custom fix prices.* Table updated.
* Bugs on crypto fixed.
* For you to know, if you choose STDV mode, the STDV lines will plot above and below the fix price, extending as far as the selected PO3 GB size, since this concept is tied to PO3 Dealing Ranges.
Release Notes
* Time window new bug fixed.Protected script
This script is published as closed-source. However, you can use it freely and without any limitations – learn more here.
Disclaimer
The information and publications are not meant to be, and do not constitute, financial, investment, trading, or other types of advice or recommendations supplied or endorsed by TradingView. Read more in the Terms of Use.
Protected script
This script is published as closed-source. However, you can use it freely and without any limitations – learn more here.
Disclaimer
The information and publications are not meant to be, and do not constitute, financial, investment, trading, or other types of advice or recommendations supplied or endorsed by TradingView. Read more in the Terms of Use.