OPEN-SOURCE SCRIPT
Crypto Heatmap [Pinescriptlabs]
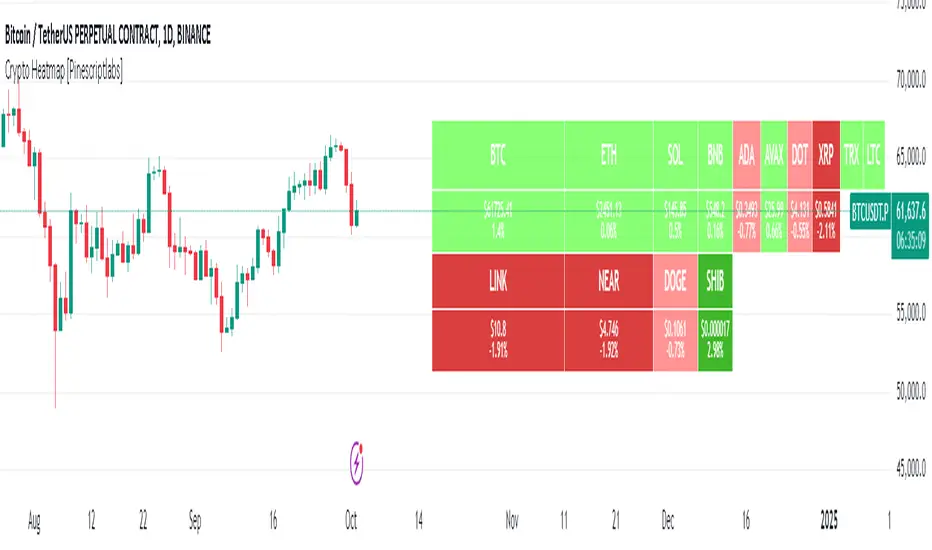
🌟 Crypto Heatmap is a visual tool that enables quick and efficient visualization of price behavior and percentage changes of various cryptocurrencies.
📊 It generates a heatmap to show variations in daily closing prices, helping traders quickly identify assets with the most movement.
📈 Percentage Change Calculation: It calculates the difference between the current price and the previous day's price, updating with each ticker.
✨ It uses a dynamic approach that adjusts colors based on market movements, making it easier to detect trading opportunities.
👀 You will notice for a moment that some cells disappear; this is because the table updates with each ticker to show real-time changes.

Español:
🌟 Crypto Heatmap es una herramienta visual que permite una rápida y eficiente visualización del comportamiento de precios y cambios porcentuales de varias criptomonedas.
📊 Genera un mapa de calor para mostrar las variaciones en los precios de cierre diario, ayudando a los traders a identificar rápidamente los activos con mayor movimiento.
📈 Cálculo del cambio porcentual: Calcula la diferencia entre el precio actual y el del día anterior, actualizándose en cada ticker.
✨ Utiliza un enfoque dinámico que ajusta los colores según los movimientos del mercado, facilitando la detección de oportunidades de trading.
Aquí tienes la traducción al español:
👀 **Observarás por un momento que algunas celdas desaparecen; esto es porque la tabla se actualiza en cada ticker para mostrar el cambio en tiempo real.**
📊 It generates a heatmap to show variations in daily closing prices, helping traders quickly identify assets with the most movement.
📈 Percentage Change Calculation: It calculates the difference between the current price and the previous day's price, updating with each ticker.
✨ It uses a dynamic approach that adjusts colors based on market movements, making it easier to detect trading opportunities.
👀 You will notice for a moment that some cells disappear; this is because the table updates with each ticker to show real-time changes.
Español:
🌟 Crypto Heatmap es una herramienta visual que permite una rápida y eficiente visualización del comportamiento de precios y cambios porcentuales de varias criptomonedas.
📊 Genera un mapa de calor para mostrar las variaciones en los precios de cierre diario, ayudando a los traders a identificar rápidamente los activos con mayor movimiento.
📈 Cálculo del cambio porcentual: Calcula la diferencia entre el precio actual y el del día anterior, actualizándose en cada ticker.
✨ Utiliza un enfoque dinámico que ajusta los colores según los movimientos del mercado, facilitando la detección de oportunidades de trading.
Aquí tienes la traducción al español:
👀 **Observarás por un momento que algunas celdas desaparecen; esto es porque la tabla se actualiza en cada ticker para mostrar el cambio en tiempo real.**
Open-source script
In true TradingView spirit, the creator of this script has made it open-source, so that traders can review and verify its functionality. Kudos to the author! While you can use it for free, remember that republishing the code is subject to our House Rules.
Disclaimer
The information and publications are not meant to be, and do not constitute, financial, investment, trading, or other types of advice or recommendations supplied or endorsed by TradingView. Read more in the Terms of Use.