OPEN-SOURCE SCRIPT
Candle Volume Core
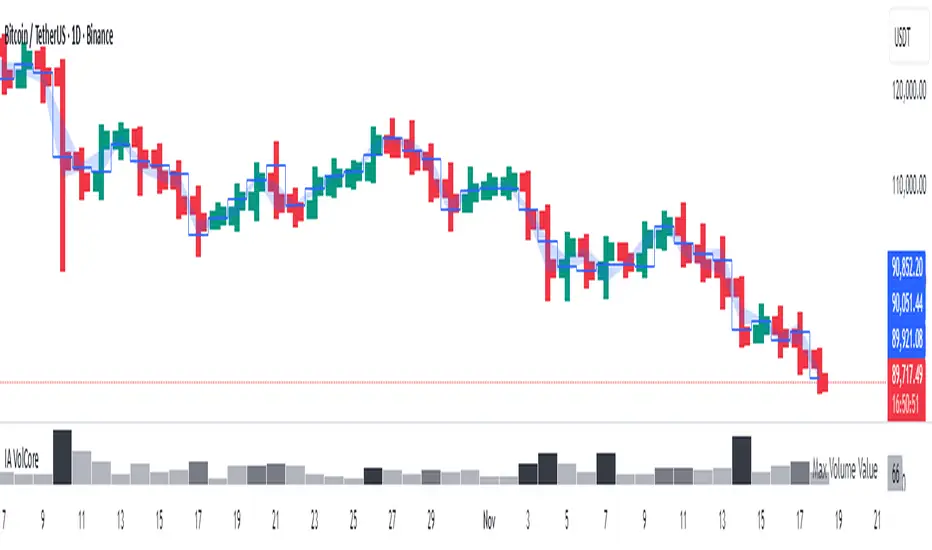
IA VolCore — Candle Volume Core
Indicator Overview
IA VolCore is an intra‑candle volume analysis tool that shows where the core traded volume is concentrated inside each candle.
It visualizes how buyers and sellers interacted within the bar and highlights key levels and zones where the highest activity takes place.
How Calculations Work
The indicator uses the lowest available timeframe data to calculate volume distribution inside each candle.
If you have a Premium or higher subscription, VolCore uses second‑based data for the most accurate results. Older candles (where second‑data is no longer available due to platform limits) are calculated using minute data. The indicator can therefore be used on any timeframe from 1 minute and higher.
If you do not have Premium, the indicator uses minute‑based data only, so it is recommended to use it from the daily timeframe and above.
Example of Calculation
If the chart timeframe is 1 hour and the lowest available timeframe is 1‑second data, the indicator loads 3600 1‑second candles. Each 1‑second candle has a known volume, which is evenly distributed across its own price range.
The 1‑hour candle is then divided into a number of price ranges based on the Candle Volume Resolution parameter. The volumes of all 3600 1-second candles are then aggregated into the corresponding price ranges of the hourly candle.
The final result is a detailed intra‑candle volume map for the entire hour — calculated using the most precise data available.
Custom Timeframe Parameter
If Use Custom Timeframe is enabled and a timeframe is selected, all calculations will be performed strictly using this specified timeframe.
For example: if the chart is on 1D, the user has 1‑second data available, but Custom TF is set to 1 minute, then the volume distribution inside each daily candle will be calculated using 1‑minute candles.
Key Features
Display Parameters (Show)
Example Use Cases (not a complete list)
IA VolCore shows where liquidity forms inside each candle, how volume is distributed, and how concentrated trading activity is.
Detecting False Breakouts
If a breakout candle shows increased volume, and after the breakout the core volume forms beyond the level, but the price moves back — VolCore provides a strong signal of a false breakout.
Examples:


Identifying Support & Resistance Zones
If Max Volume Level repeatedly forms in the same internal range over multiple candles, this indicates a hidden support or resistance level.
Example:

Who This Indicator Is For
For traders using volume‑based and contextual market analysis, and for IA (Initiative Analysis) ecosystem users who want a deeper understanding of intra‑candle structure.
Histogram Color Logic
IA VolCore uses three color shades to highlight volume behavior relative to previous candles:
This helps quickly spot growing activity and potential shifts in market pressure.
Style Settings
Line styles, histogram styles, and colors can be customized in the indicator’s Style tab.
Indicator Overview
IA VolCore is an intra‑candle volume analysis tool that shows where the core traded volume is concentrated inside each candle.
It visualizes how buyers and sellers interacted within the bar and highlights key levels and zones where the highest activity takes place.
How Calculations Work
The indicator uses the lowest available timeframe data to calculate volume distribution inside each candle.
If you have a Premium or higher subscription, VolCore uses second‑based data for the most accurate results. Older candles (where second‑data is no longer available due to platform limits) are calculated using minute data. The indicator can therefore be used on any timeframe from 1 minute and higher.
If you do not have Premium, the indicator uses minute‑based data only, so it is recommended to use it from the daily timeframe and above.
Example of Calculation
If the chart timeframe is 1 hour and the lowest available timeframe is 1‑second data, the indicator loads 3600 1‑second candles. Each 1‑second candle has a known volume, which is evenly distributed across its own price range.
The 1‑hour candle is then divided into a number of price ranges based on the Candle Volume Resolution parameter. The volumes of all 3600 1-second candles are then aggregated into the corresponding price ranges of the hourly candle.
The final result is a detailed intra‑candle volume map for the entire hour — calculated using the most precise data available.
Custom Timeframe Parameter
If Use Custom Timeframe is enabled and a timeframe is selected, all calculations will be performed strictly using this specified timeframe.
For example: if the chart is on 1D, the user has 1‑second data available, but Custom TF is set to 1 minute, then the volume distribution inside each daily candle will be calculated using 1‑minute candles.
Key Features
- Candle Volume Resolution — defines how many price ranges each candle is divided into (3–50,000). All calculations in the indicator are based on this resolution.
- Max Volume Level — displays the price level inside the candle where the maximum volume occurred.
- % of Volume (1, 2, 3) — defines percentages of the candle's total volume (e.g., 33%, 66%, 50%). For each percentage, VolCore finds the minimum price range containing that share of volume. You can view the corresponding volume values for these shares in histogram form via the Show: Vol % 1–3 parameters. The actual intra-candle zones are displayed using the Show area option.
- Volume % for Density — sets the volume percentage used to calculate Vol Density, which reflects how concentrated the volume is inside the selected price range.
Display Parameters (Show)
- Show: Vol % 1–3 — shows histograms of volume share zones based on the selected "% of Volume" parameters (with color logic applied).
- Show: Max Volume Value — displays the maximum internal volume value for each candle as a histogram (with color logic applied).
- Show: Volume — displays the candle's total volume (with color logic applied).
- Show: Vol Density — shows the density of volume distribution inside the candle for the selected volume percentage (with color logic applied).
Example Use Cases (not a complete list)
IA VolCore shows where liquidity forms inside each candle, how volume is distributed, and how concentrated trading activity is.
Detecting False Breakouts
If a breakout candle shows increased volume, and after the breakout the core volume forms beyond the level, but the price moves back — VolCore provides a strong signal of a false breakout.
Examples:
Identifying Support & Resistance Zones
If Max Volume Level repeatedly forms in the same internal range over multiple candles, this indicates a hidden support or resistance level.
Example:
Who This Indicator Is For
For traders using volume‑based and contextual market analysis, and for IA (Initiative Analysis) ecosystem users who want a deeper understanding of intra‑candle structure.
Histogram Color Logic
IA VolCore uses three color shades to highlight volume behavior relative to previous candles:
- light shade — normal volume, no significant change,
- medium shade — volume exceeds both previous candles,
- dark shade — volume exceeds the sum of the previous two candles.
This helps quickly spot growing activity and potential shifts in market pressure.
Style Settings
Line styles, histogram styles, and colors can be customized in the indicator’s Style tab.
Open-source script
In true TradingView spirit, the creator of this script has made it open-source, so that traders can review and verify its functionality. Kudos to the author! While you can use it for free, remember that republishing the code is subject to our House Rules.
Рыночные сценарии, инструкция к индикатору, практические примеры — t.me/ialogic
Market scenarios, indicator guide, practical examples — t.me/initiativeanalysis
Clarity on the Chart. Smart Trading Decisions
Market scenarios, indicator guide, practical examples — t.me/initiativeanalysis
Clarity on the Chart. Smart Trading Decisions
Disclaimer
The information and publications are not meant to be, and do not constitute, financial, investment, trading, or other types of advice or recommendations supplied or endorsed by TradingView. Read more in the Terms of Use.