Ghost Candles [BruzX]
This indicator provides a visual representation of volume intensity by adjusting bar transparency based on statistical volume analysis. Unlike traditional volume indicators that only show volume bars below the chart, Ghost Candles can integrates volume information directly into the price bars themselves.
█ FEATURES
- Visual Volume Integration: Volume information is embedded directly in price bar appearance, reducing the need to constantly reference volume bars
- Statistical Significance: Uses z-score calculations rather than simple comparisons to identify truly unusual volume
- Customizable Colours: Separate colour inputs for bullish and bearish candles to match your chart theme
- Volume Bar Colouring: Optional synchronized colouring of volume bars to match candle transparency
- Moving Average Display: Shows the volume moving average line for reference
- Alert System: Built-in alerts for different volume intensity levels (Extra High, High) for both bullish and bearish movements
█ HOW TO USE
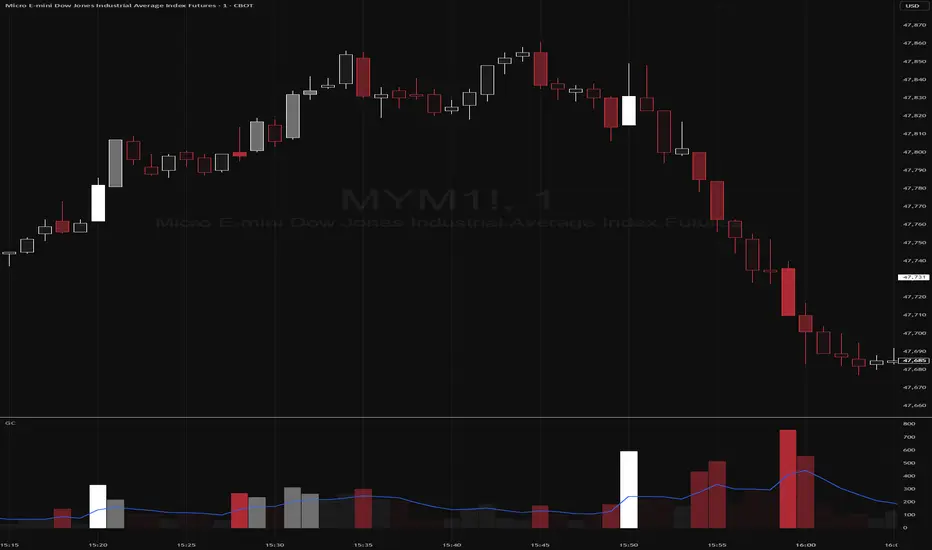
The indicator creates a new volume pane. This replaces the need for the based volume plot which can be removed. It also affects the transparency of the price bars based on volume. Both these features can be toggled on and off independently from each other in the setting.
All candles remain coloured according to their direction (green/red by default), with only the transparency changing based on volume intensity. Please note the the price bars will be coloured by the colours set in this indicator even if the price bar ghosting option is switched off.
This indicator is particularly useful for traders who prioritize volume analysis in their decision-making process but prefer a cleaner chart without multiple overlapping indicators.
- Breakout Confirmation: Fully opaque candles during breakouts indicate strong volume support
- Trend Strength: Series of transparent candles may indicate weakening trend momentum
- Support/Resistance Validation: High volume at key levels appears as prominent candles
- Volume Divergence: Easy identification when price moves occur on declining volume( increasingly transparent candles)
█ CONCEPTS
The indicator performs statistical analysis on volume data using a dual-period approach:
- A default 7-period (adjustable) lookback for calculating the volume moving average
- A default 20-period (adjustable) lookback for calculating standard deviation
It then computes a z-score (standard deviations from the mean) for each price bar's volume to determine its statistical significance. Based on configurable thresholds, price bar bodies are rendered with varying levels of transparency:
- Extra High Volume (z-score > 2 by default)): Fully opaque candles (0% transparency) (default)
- High Volume (z-score > 1.25 by default): 70% opacity (default)
- Normal Volume (z-score > 0.5 by default): 40% opacity (default)
- Below Normal Volume: 5% opacity(default)
█ ACKNOWLEDGMENT
This indicator is based on previous, no longer publicly available work by user "callstacked". It has been modified and improved. It is published as a public invite-only indicator with his permission.
█ DISCLAIMER
This indicator is provided for information only and should not be used in isolation without considering other factors. You should not take trades using real money based solely on what this indicator says. Any trades you take are entirely at your own risk.
Invite-only script
Only users approved by the author can access this script. You'll need to request and get permission to use it. This is typically granted after payment. For more details, follow the author's instructions below or contact BruzX directly.
TradingView does NOT recommend paying for or using a script unless you fully trust its author and understand how it works. You may also find free, open-source alternatives in our community scripts.
Author's instructions
Disclaimer
Invite-only script
Only users approved by the author can access this script. You'll need to request and get permission to use it. This is typically granted after payment. For more details, follow the author's instructions below or contact BruzX directly.
TradingView does NOT recommend paying for or using a script unless you fully trust its author and understand how it works. You may also find free, open-source alternatives in our community scripts.