OPEN-SOURCE SCRIPT
US 10Y - US 2Y Spread
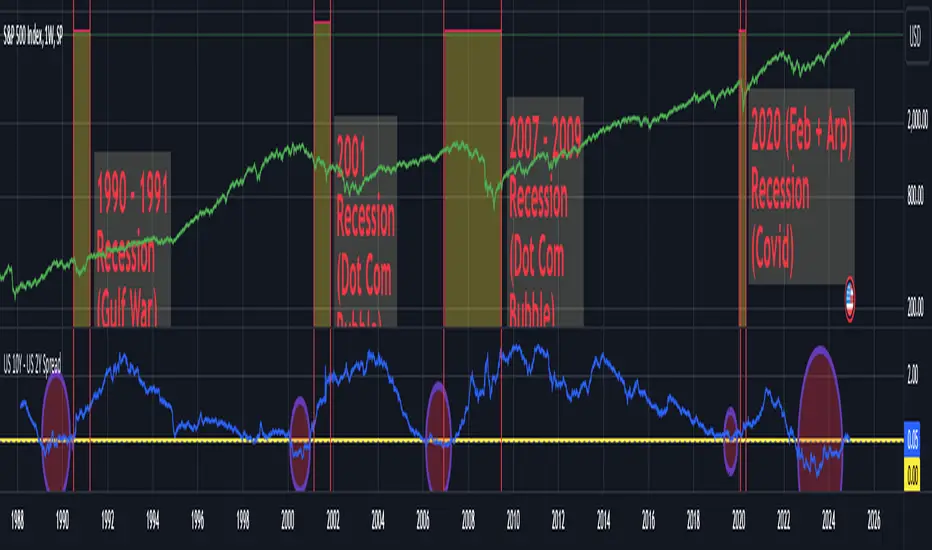
This script displays the Yield Spread between the 10 Year US Treasury Bond (US10Y) and the 2 Year US Treasury Bond (US02Y) as a blue line beneath the chart. It is best to be used on weekly charts a the yield spread is a leading indicator used for detecting possible recessions within the US economy.
A negative yield spread means the 2 year treasury bonds are paying a higher yield than 10 year treasury bonds indicating a possible slowdown of the US economy. In the past negative yield spreads where often followed by recessions and major corrections of the S&P500... you can see examples for this on the above chart for the Gulf War recession, the DotCom Bubble recession, the great recession due to the US housing market collapse and the short COVID recession.
Currently we are in an extended phase of negative yield spreads and if history repeats itself we could be in for a major correction on the financial markets within the next years.
Open-source script
In true TradingView spirit, the creator of this script has made it open-source, so that traders can review and verify its functionality. Kudos to the author! While you can use it for free, remember that republishing the code is subject to our House Rules.
Disclaimer
The information and publications are not meant to be, and do not constitute, financial, investment, trading, or other types of advice or recommendations supplied or endorsed by TradingView. Read more in the Terms of Use.