Pine Script® indicator
2-sell
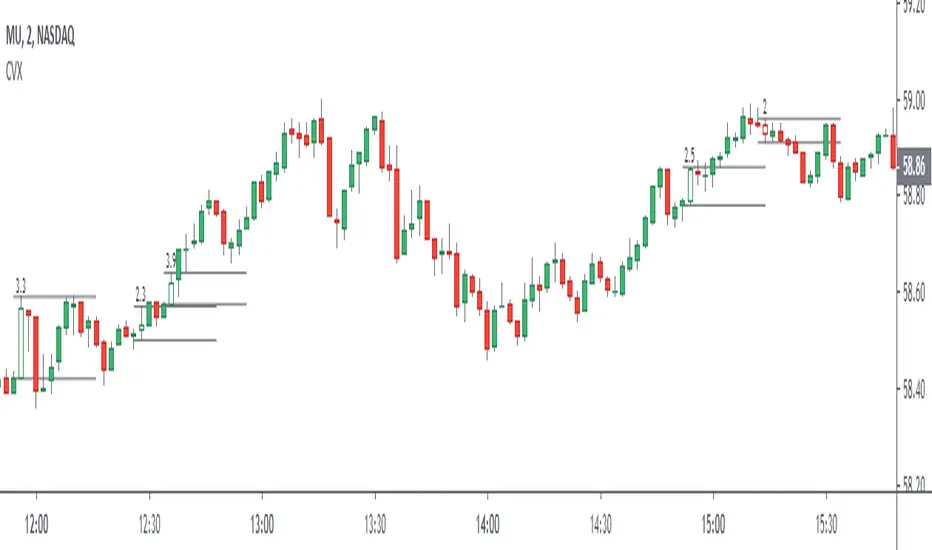
Strategy PyramiCoverStrategy for pyramidization and coverage. (Indicator PyramiCover)
Recommended time frame 60 min.
Pine Script® strategy

Premium Stochastic OscillatorThe PSO is a rewired version of a short-period stochastic. Unlike a standard stochastic oscillator, this indicator is normalized to register neutral values at zero while providing greater sensitivity to short-term price moves. This indicator uses a central zero line as a reference point and will oscillate above and below this point as price fluctuates. In addition, the PSO is smoothed by using a double exponential moving average to provide a more even response to turns in the market.
(from TASC magazine, August 2008 issue).
The Premium Stochastic Oscillator was introduced by technical analyst Lee Leibfarth.
Pine Script® indicator

Normalized Smoothed MACDMACD normalized with its highest and lowest values over the last “Normalization period”
- includes alerts
Pine Script® indicator

KDJ Indicator The KDJ indicator is derived from the Stochastic with the one difference being the addition of the J line. This implies that the KDJ indicator has a total of three lines; %K%D%J. The %J is simply put, the difference between the %K and the %D lines, which is similar to the MACD.
The difference between the %J and that of the MACD is that it is plotted as a histogram and the second being that the value are weighted and as such delivers more emphasis on the shorter term %K line.
What we now have is a line that moves quite slowly and has the knack to move beyond the range of a normal stochastic indicator.
Pine Script® indicator

Market ModeThe Market Mode indicator seeks to identify trends and rebounds by identifying “phases” according to the principles of John Ehlers.
- When the oscillator passes above the top line, the market is in an uptrend.
- When the oscillator goes below the bottom line, the market is in a downtrend.
- Between these two levels, the market is calmer and could rebound in the direction of the initial trend and / or phase of trend change.
Pine Script® indicator

Strategy Quadratic Semaphore I add a basic strategy for the "Quadratic traffic light" indicator, it can help to find a good configuration.
Regards.
Pine Script® strategy
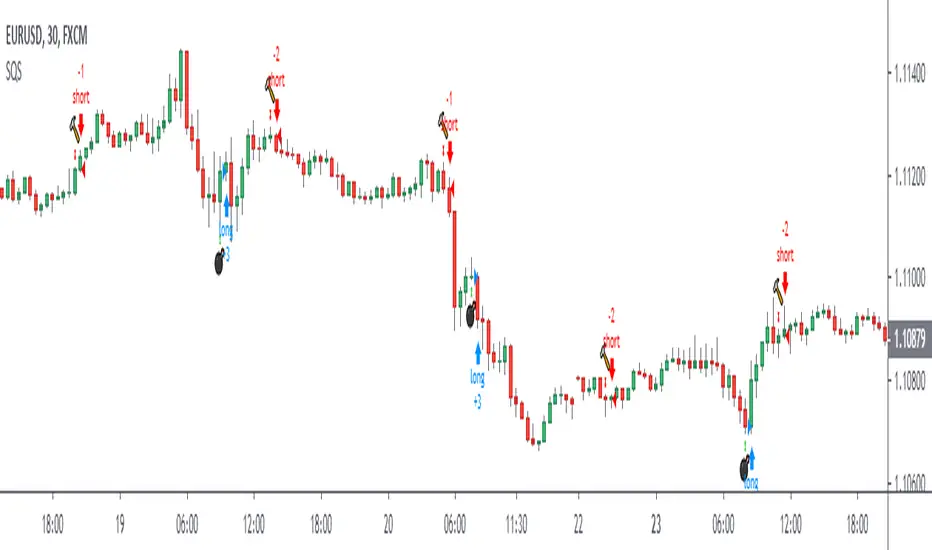
Quadratic SemaphoreThe quadratic semaphore indicator is an indicator that find confirmed market u-turn with the help of 2 quadratic regression calculated with Highs and Lows over the last “length” periods.
- “p” setting is candlesticks quantity to confirmed the quadratic regression has formed a High or Low parabola, such as Fractals. Consecutive same signals can happen due to the use of different price values for upper and lower semaphore.
- Adjust the settings to your instrument and time frame.
- Alerts included.
Success with your trade¡¡
Pine Script® indicator
Long Tail Candle by Oliver VelezThis script detects an event created by Oliver Velez, it is a wide-range candle with a small body and a long tail (hammer-type candle), its range is noticeably larger than previous candles, as a rule it can be taken that the body should be maximum of 30% of the total range of the candle with a long tail. The stop goes under the tail and the signal is given when the next candle followed by the long tail candle exceeds its body, do not program this condition so that the alert indicates that a long tail candle was generated and the trader has some Time to visualize the graph and wait for the signal.
The default configuration is very basic, each trader must adjust to their needs.
- Trend filters can be activated.
- Alerts available.
Thumbs up
Pine Script® indicator
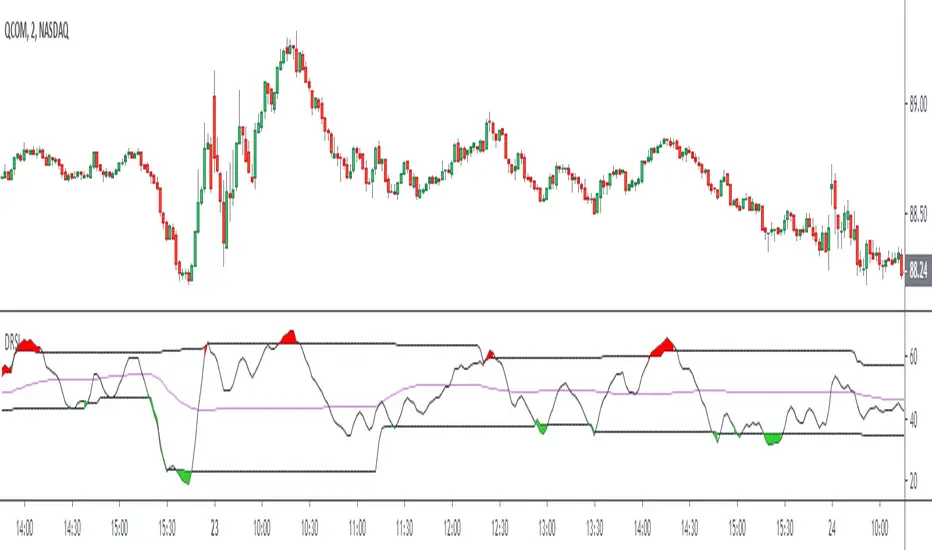
Dynamic RSIThe Dynamic RSI indicator is a kind of exponential RSI. The overbought and oversold levels (respectively HiLine and LoLine) are calculated according to the recent highest and lowest values of the Dynamic RSI line.
Pine Script® indicator
TMMS OscillatorThe TMMS oscillator (aka “Trading Made More Simpler”) is an indicator made of conditions based on both 2 separated Stochastic and 1 RSI.
Bullish zone is green and bearish one is red. When the histogram is grey, no signals is available at that time.
The indicator has an option to show the current trend of an Hull moving average (ascending or descending curve). When the trend is up, green dots are plotted on the zero line. When the trend is down, the dots are coloured in red.
Greetings, success with your trade!!!
Pine Script® indicator

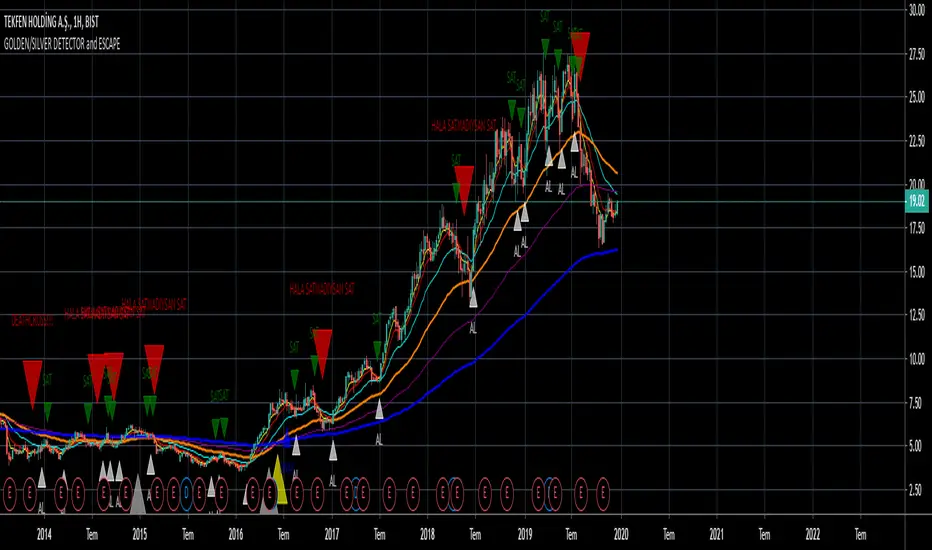
GOLDEN/SILVER DETECTORFind golden and silver crosses with using EMA.
Note
Colors are depends on you.
Translation
AL = BUY
SAT = SELL
ONAY = CONFIRMATION
Pine Script® indicator
Pine Script® indicator

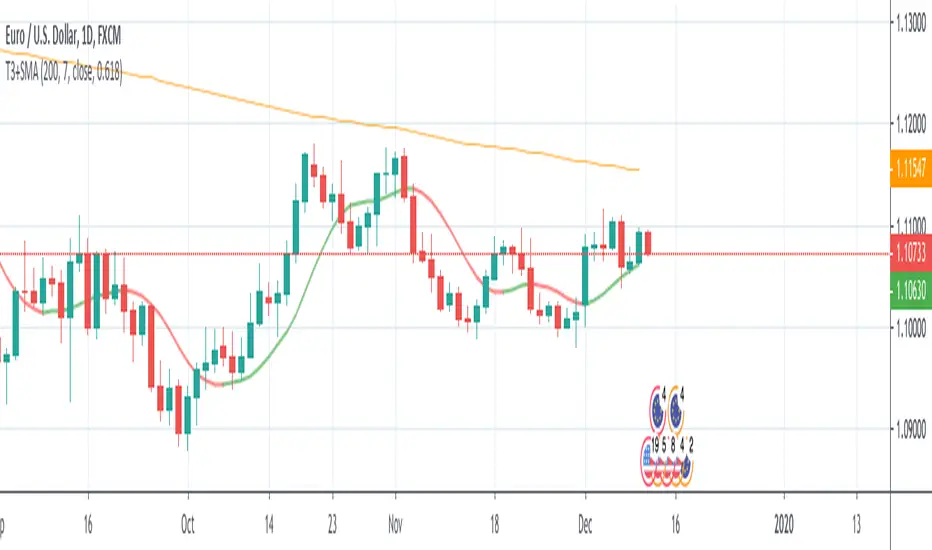
T3+SMA This source code is subject to the terms of the Mozilla Public License 2.0 at mozilla.org
© 03.freeman
This strategy is based only on T3 moving average, but uses sma 200 as filter for enter long or short.
The default settings considers a daily timeframe.
The strategy is very simple: long if T3 increase, short if T3 decrease.
Note that if you set volume factor to 0 you will have an exponential moving average, while if you set to 1 you'll get a DEMA.
Pine Script® strategy
Bollinger Bands on MacdOnly longs when Macd line is above Bollinger Band and shorts when Macd line is above Bollinger Band, this will avoid many problems.
thumbs up!!!
Pine Script® indicator

Climatic Volume X- Climate volume detection
- Relative volume value in bar
- Automatic zone generation (possibility of configuration)
- Additional features
¡¡¡Thumbs up¡¡¡
Pine Script® indicator
Elephant Bar by Oliver VelezThis script detects an event created by Oliver Velez, basically it is a wide-range candle, its range is noticeably larger than the previous candles, this event indicates a possible continuation of the movement, or the beginning of an extended movement. The candle has to be of good body, as a rule it can be taken that the body must be more than 70%. The stop goes below the minimum of the candle and the signal is given when the next candle followed by the elephant candle exceeds its body, this condition is not programmed so that the alert indicates that an elephant candle was generated and the trader has some time to visualize the graph and wait for the signal. Example below:
NOTE: IT IS VERY IMPORTANT THAT THE TRADER ANALYZE THE CONTEXT OF THE MARKET WHERE THE ELEPHANT BAR IS GENERATED AND DETERMINE ACCORDING TO ITS EXPERIENCE IF THE EVENT HAS A GOOD PROBABILITY OF PROJECTION, YOU MUST NOT TAKE AN ENTRY ONLY BY THIS EVENT, IF YOU DO YOU WILL LOSE ALL YOUR MONEY
.
One of the problems of the elephant bar is that it generates a fairly wide risk unit with respect to other narrow range events, so the risk / benefit ratio is not very large, but it is an event that deserves attention when it occurs in a good location since it generally generates continuation.
If you want to have a lower risk unit and improve the risk / benefit ratio, you can play the “Gift Zone”, when detecting an elephant bar you can wait for a step back inside the elephant bar area and take a position, this will give you a less distance to the stop, but this can lead to the event escaping if there is no recoil.
- The size of the candle is determined by comparing a range of previous candles (you can set the amount at your discretion)
- Search factor: by default 1.3, this means that all bars that have a range greater than the average range of previous candles + 30%, are considered elephant candles (can be configured at your discretion)
- Possibility to configure the percentage of the body that the elephant candle must have.
- Possibility of filtering up to 2 means with direction detection and color change (fully configurable)
- Possibility of filtering by mobile averages
- Alerts
- Additional features
Thumb up if you liked me ..
Pine Script® indicator

MFI/RSIThis is a simple study that combines MFI and RSI and provides buy/sell alerts.
The red lines are MFI.
the blue lines are RSI.
Boundries are colored as the indicators and are user configurable.
Black triabgles are buy/sell points when both MFI and RSI are overbought/sold.
Pine Script® indicator

Market Thrust IndicatorThe Market Thrust indicator is a powerful measure of the stock market's internal strength or weakness. There are four components to this indicator:
1-Advancing Issues on the New York Stock Exchange (NYSE) – $ADV
2-Advancing Volume on the NYSE – $UVOL
3-Declining Issues on the NYSE – $DECL
4-Declining Volume on the NYSE – $DVOL
The formula for Market Thrust is given below:
($ADV x $UVOL)-($DECL x $DVOL)
When used for day-trading, the trend of the Market Thrust indicator is what is most important.
Rising Market Thrust Indicator: Considered a bullish sign; can act as a confirmation signal when combined with a rising stock, index ETF, or stock index future's price.
Falling Market Thrust Indicator: Considered a bearish sign; can act as a confirmation signal of a decreasing market price.
The Market Thrust indicator could be used for detecting divergences in trends. Divergences occur when:
- Price is trending higher, but the Market Thrust indicator is not moving higher or is even going down.
- Price is trending lower, however, the Market Thrust technical analysis tool is not trending lower, it is either not trending or is trending higher.
Add a fully configurable trend line over MTI.
Read more at: commodity.com
Pine Script® indicator

Leledc Exhaustion Bar V4 PLUSLeledc Exhaustion Bar indicator created by glaz converted to Pine 4, plotshape was added.
Pine Script® indicator

Double MACD Buy and SellIndicator for strategy that was used in a Forex competition and was a winner. Use double MACD with custom settings, search video on YouTube:
Learn Five Powerful MACD Trading Strategies
Add some tools to analyze the market context a little more:
- Detector of regular and hidden divergences.
- Atlas Zone (detects consolidation that is about to generate a movement)
- Choppines zone configurable (detects if the market is stable or not)
Visualization of entries in trend and counter-trend according to the rules described in the video.
Buy and sell alerts.
Note: I do not recommend using only this indicator as an investment strategy, it is another tool that must be complemented with a market study by the trader.
Pine Script® indicator
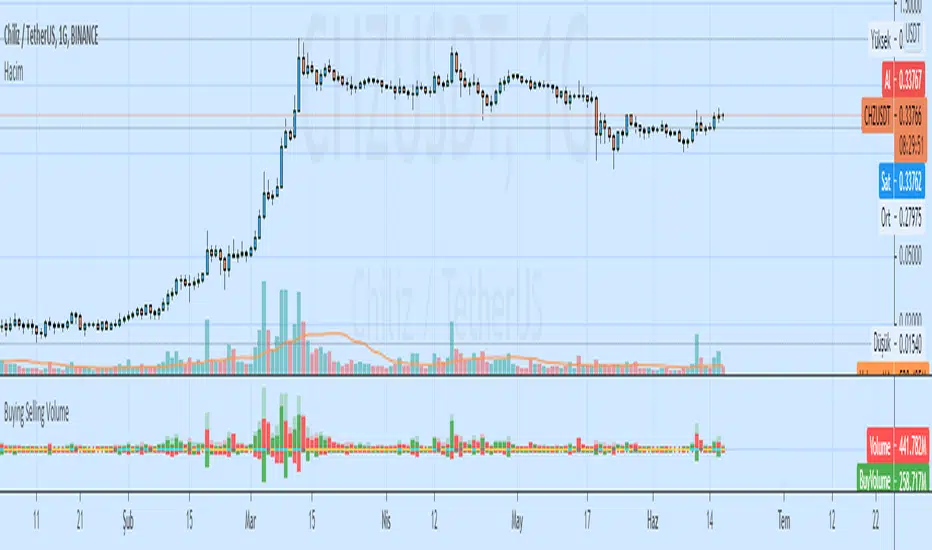
🐳 Whales 🆚 Little Fish 🐟THIS INDICATOR DETERMINES WHAT THE STRONG HANDS AND WEAK HANDS ARE DOING, BASED ON THE FAMOUS INDICATOR "KONCORDE", OBTAINED FROM THE PERCENTARY VARIATION OF THE INDICATOR IVP (POSITIVE VOLUME INDEX) AND IVN (VOLUME INDEX). ANYONE READING THE AVAILABLE DOCUMENTATION ON THESE TWO SMALL MATHEMATICAL JEWELRY WILL DISCOVER THAT THE ATTRIBUTED VOLUMES NEGOTIATED TO STRONG HANDS (IVN) OR WEAK HANDS (IVP).
NOTE: USE THIS INDICATOR ONLY IN INSTRUMENTS WITH REAL VOLUME.
Pine Script® indicator

Buying Selling VolumeBuying Selling Volume
-Buy Volume
-Sell Volume
-Buy Volume Percent %
-Sell Volume Percent %
-Volume Index
-Buy Sell Volume-
BuyVolume>SellVolume=Blue barcolor
SellVolume>BuyVolume=Purple barcolor
-Volume Index-
VolumeIndex>length and close > open =Cyan barcolor
VolumeIndex>length and close < open =Gray barcolor
VolumeIndex<=length = Yellow barcolor
Pine Script® indicator