Quality-Controlled Trend Strategy v2 (Expectancy Focused)This script focuses on quality control rather than curve-fitting.
No repainting, no intrabar tricks, no fake equity curves.
It uses confirmed-bar entries, ATR-based risk, and clean trend logic so backtests reflect what could actually be traded live.
If you publish scripts, this is the minimum structure worth sharing.
Why this script exists
TradingView’s public scripts are flooded with:
repainting indicators
no stop-loss logic
curve-fit entries that collapse live
strategies that look good only in hindsight
This script is intentionally boring but honest.
No repainting.
No intrabar tricks.
No fake equity curves
The goal is quality control, not hype.
What this strategy enforces
✔ Confirmed bars only
✔ Single source of truth for indicators
✔ Fixed risk structure
✔ No signal repainting
✔ Clean exits with unique IDs
✔ Works on any liquid market
Trading Logic (simple & auditable)
Trend filter
EMA 50 vs EMA 200
Entry
Pullback to EMA 50
RSI confirms momentum (not oversold/overbought)
Risk
ATR-based stop
Fixed R:R
One position at a time
This is the minimum bar for a strategy to be considered publish-worthy.
Why this helps TradingView quality
Most low-value scripts fail because they:
hide repainting logic
skip exits entirely
use inconsistent calculations
rely on hindsight candles
This strategy forces discipline:
every signal is confirmed
every trade has defined risk
behavior is repeatable across symbols & timeframes
If more scripts followed this baseline, TradingView’s public library would be far more usable.
50

Daily 50‑ & 200‑SMA Ceiling Radar — EnhancedDescription:
This custom TradingView indicator, developed by Trader Malik and licensed under Trades Per Minute, is a powerful visual tool for identifying how price behaves relative to major daily moving averages — the 50-SMA and 200-SMA. It helps traders quickly understand key technical dynamics such as trend alignment, MA proximity, and short-term momentum sentiment — all displayed on a clean, minimal overlay with visual alerts and an adjustable data table.
FEATURES
1. Daily 50 & 200 Simple Moving Averages (SMA):**
- Displayed directly on the chart using distinct blue and orange lines.
- These serve as primary trend filters and support/resistance zones.
2. Price Highlighting:
- A red background flashes momentarily when the price crosses either the 50-SMA or 200-SMA.
- A green background fills the chart when price is above both MAs (bullish zone).
- A red background persists if price is below both MAs (bearish zone).
3. MA Gap Analysis Table:
- 50-SMA Row**: Shows % gap between 50-SMA and 200-SMA.
- 200-SMA Row**: Shows % gap between 200-SMA and 50-SMA.
- Sentiment Row**: Displays short-term trend bias based on the slope of the past 7 daily closes — Bullish, Neutral, or Bearish.
USER SETTINGS
Table Location: Choose between **Top Right** or **Bottom Right** of the chart.
Table Size: Select **Small**, **Medium**, or **Large** to suit screen preferences and layout aesthetics.
This script is **intellectual property of Trades Per Minute** and distributed by **Trader Malik** for use under licensing terms. Redistribution or repurposing without authorization is strictly prohibited.

Triple EMA (20, 50, 200) w/ LabelsI've combined the 20, 50, and 200 day exponential moving averages and added labels.
I created this due to finding EMA scripts that are either nothing but ugly to look at or have extra "features" that serve no purpose.
This gets rid of the clutter and gives a simple triple EMA with labels.
Labels are optional, you can turn them off in the settings.

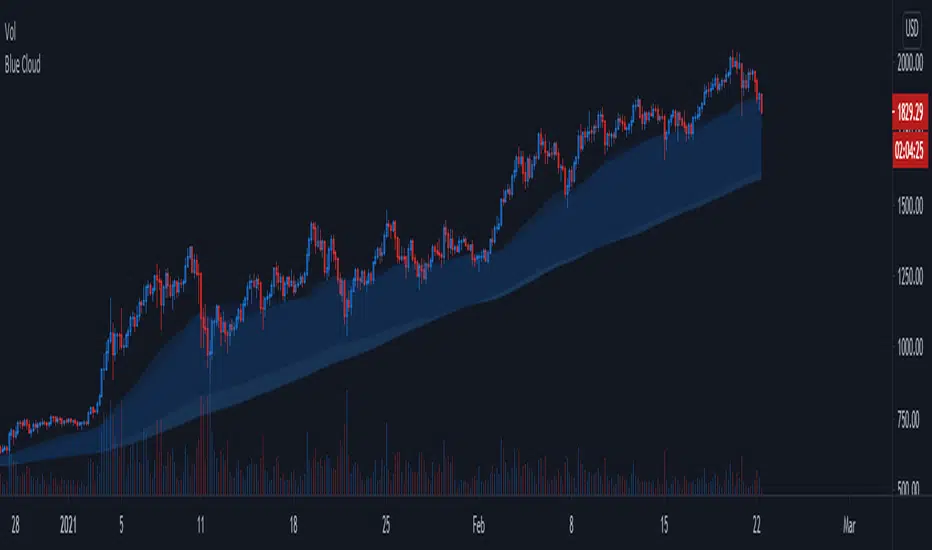
Blue CloudTrend Indicator
- Based on 4h 50/200 ma/ema
- Static, same accross all timeframes
- Works best with trending assets (espacially altcoins)
- 4h 50/200 ma/ema 's are transparent by default but can be enabled to improve visibility
Blue Cloud = Bullish, cloud often acts as support
Red Cloud = Bearish, cloud often acts as resistance

50-100-200 Day SMAA simple indicator that display the 50, 100, and 200 Daily SMA. It will always display the DAILY 50,100, 200, regardless of the time frame you are looking at. Makes it easy to quickly display these key averages while also looking at smaller timeframes like 1H candles.


SMA 50/100 / 200Couldn't find a simple moving average that combined the three i was looking for so I made it. Nothing special.

50,100,200 MA by CryptoLife71(FIXED)Updated the code by CryptoLife71 so that the 200ma shows correctly.


