NeuraEdge Block Trades v1.0NEURAEDGE BLOCK TRADES
═══════════════════════════════════════════════════════════════════════
We are excited to release Block Trades!
WHY THIS INDICATOR EXISTS?
Retail traders face a fundamental challenge: institutions move markets, but their activity is hidden. When smart money accumulates at support or distributes at resistance, retail traders often find themselves on the wrong side of the move.
Understanding where institutions are actively buying or selling is crucial for:
• Validating trade setups with volume confirmation
• Identifying supply and demand zones that actually hold
• Avoiding false breakouts driven by retail sentiment
• Spotting accumulation before major moves up
• Detecting distribution before major moves down
Most volume indicators simply show size without context. Block Trades was created to bridge this gap by detecting abnormally large volume bars and determining their directional bias, giving retail traders insight into institutional activity.
═══════════════════════════════════════════════════════════════════════
WHAT IT DOES:
Block Trades identifies volume spikes that likely represent institutional order flow and classifies them as buying pressure, selling pressure, or contested zones. The indicator then validates these prints against directional flow analysis and groups nearby prints into accumulation or distribution clusters.
This helps you answer critical questions:
• Is this support level being defended by institutions?
• Are smart money players distributing into this rally?
• Is heavy volume confirming my trade or warning against it?
• Where are institutional interest zones forming?
KEY FEATURES:
• Multi-tier volume detection (Large: 2x, Huge: 3x, Massive: 5x average)
• Directional classification with flow validation
• Accumulation/distribution zone detection
• Print clustering for institutional interest areas
• Confluence scoring system (0-10 points)
• Real-time statistics dashboard
• Clean, minimal chart labels
═══════════════════════════════════════════════════════════════════════
HOW IT WORKS:
VOLUME SPIKE DETECTION
The indicator monitors volume against a moving average baseline. When current volume significantly exceeds this average (default thresholds: 2x, 3x, 5x), it flags the bar as a potential institutional print.
DIRECTIONAL CLASSIFICATION
Buy Print: Large volume + closes in top 70% of range
Sell Print: Large volume + closes in bottom 70% of range
Neutral Print: Large volume + mid-range close (absorption/contested)
The close position within the bar's range reveals who won the battle. A bar with massive volume that closes near its high indicates aggressive buying. The same volume closing near the low indicates aggressive selling.
FLOW VALIDATION
Each print is validated against underlying institutional flow calculations. This filters out volume spikes that don't align with directional pressure, significantly reducing false signals. Buy prints require bullish flow, sell prints require bearish flow.
ACCUMULATION & DISTRIBUTION ZONES
When multiple prints occur at similar price levels with consistent direction:
• Repeated buy prints + bullish trend = Accumulation (institutions building positions)
• Repeated sell prints + bearish trend = Distribution (institutions unloading positions)
These zones often become powerful support/resistance levels because institutions have established significant positions there.
PRINT CLUSTERING
The indicator groups nearby prints (within configurable ATR distance) into clusters. When 3 or more prints form a cluster, it marks an institutional interest zone. These clusters frequently act as price magnets and reversal points.
PRINT CLUSTERING
The indicator groups nearby prints (within configurable ATR distance) into clusters. When 3 or more prints form a cluster, it marks an institutional interest zone. These clusters frequently act as price magnets and reversal points.
CONFLUENCE SCORING
Each print receives a confluence score (0-10 points) based on:
• Volume size (Massive: +3, Huge: +2, Large: +1)
• Flow alignment (+2 points, configurable)
• Trend alignment (+1)
• New high/low made (+1)
• Extreme close position (+1)
Prints with 5+ points receive a star marker, indicating ultra-high conviction setups.
═══════════════════════════════════════════════════════════════════════
HOW TRADERS USE IT:
USE CASE 1: TRADE VALIDATION
Your system signals a long entry at support. Check Block Trades:
• Buy prints present at this level? Institutions defending = Take the trade
• Sell prints present? Institutions distributing = Skip or wait
• No prints? Proceed with normal risk management
USE CASE 2: IDENTIFYING EXHAUSTION
Price rallies to resistance with heavy volume:
• Sell prints appear = Distribution, institutions unloading into strength
• Likely reversal coming, consider shorts or exit longs
• Confirmed by multiple sell prints = High conviction reversal setup
USE CASE 3: FINDING SUPPORT/RESISTANCE
Accumulation cluster forms at 450 level:
• Multiple buy prints over several sessions
• Institutions building positions at this price
• 450 becomes high-probability support for future pullbacks
• Use for entries or stop placement
USE CASE 4: BREAKOUT CONFIRMATION
Price breaks above key resistance:
• Buy print on breakout bar = Real institutional participation
• High confluence score (5+) = Ultra-high conviction
• Fake breakout would show sell prints or no prints
USE CASE 5: AVOIDING TRAPS
Price spikes up on huge volume:
• Sell print appears (closes low in range) = Trap
• Institutions selling into retail FOMO
• Avoid chasing, prepare for reversal
═══════════════════════════════════════════════════════════════════════
VISUAL ELEMENTS:
ON-CHART LABELS
Buy Print: Green label below bar showing size (LARGE/HUGE/MASSIVE)
Sell Print: Red label above bar showing size
Contested Print: Orange label at bar high (large volume, mid-range close)
Accumulation: Green "ACCUM" label with diamond symbol
Distribution: Red "DISTRIB" label with diamond symbol
WHAT CONTESTED MEANS:
When a bar has massive volume but closes in the middle of its range (neither top nor bottom 70%), it indicates a battle between buyers and sellers with no clear winner. This often occurs at:
• Major support/resistance levels where institutions are absorbing supply/demand
• Transition zones before a directional move
• Areas of genuine price discovery and uncertainty
Contested prints can signal absorption (institutions quietly building positions) or genuine indecision. Watch for follow-through on the next bar to determine which side won.
LABEL MODIFIERS
∆ checkmark = Flow validated (institutional flow aligns with print)
Star symbol = High confluence (5+ points, ultra-high conviction)
CLUSTER ZONES
Semi-transparent boxes marking areas where multiple prints occurred
Extend to the right to show ongoing institutional interest zones
Color-coded: green for bullish clusters, red for bearish clusters
DASHBOARD (TOP RIGHT)
• Current volume state and ratio
• Institutional flow direction
• Cumulative trend direction
• Recent print count (last 20 bars)
• Active cluster count
• Volume thresholds
STATISTICS (BOTTOM LEFT)
• Total session prints
• Buy/sell percentage split
═══════════════════════════════════════════════════════════════════════
SETTINGS:
PRINT DETECTION
• Volume Lookback Period: 20 bars (for average calculation)
• Large Print Threshold: 2.0x average
• Huge Print Threshold: 3.0x average
• Massive Print Threshold: 5.0x average
• Min Candle Size: 0.3x ATR (filters doji bars)
CLASSIFICATION
• Directional Threshold: 70% (how far in range to qualify as buy/sell)
• Show Neutral Prints: Toggle contested zones
• Require New High/Low: Optional stricter filter
INSTITUTIONAL FLOW
• Enable Flow Confluence: On/Off toggle
• Flow Confluence Weight: 2 points (adjustable 1-5)
CLUSTERING
• Enable Clustering: On/Off
• Cluster Distance: 1.0x ATR (how close prints must be)
• Min Prints for Cluster: 3 prints
• Show Cluster Zones: On/Off
DISPLAY
• Show Print Labels: Toggle all labels
• Show Accumulation/Distribution/Contested Labels: Toggle special labels
• Label Size: Tiny/Small/Normal
• Colors: Customizable buy/sell/neutral colors
FILTERS
• Minimum Volume: 0 (set threshold to ignore low volume bars)
• Session Filter: Avoid first/last 15 minutes (low liquidity)
═══════════════════════════════════════════════════════════════════════
BEST PRACTICES:
DO:
✓ Use as confluence with your primary trading system
✓ Pay attention to accumulation/distribution zones
✓ Look for high confluence prints (5+ stars)
✓ Validate breakouts with print direction
✓ Use cluster zones as future support/resistance
✓ Combine with higher timeframe analysis
✓ Works best on liquid instruments (major pairs, indices, large cap stocks)
DON'T:
✗ Trade prints as standalone buy/sell signals
✗ Ignore the directional classification (context matters)
✗ Use on low-volume instruments (prints less reliable)
✗ Chase every print without confluence confirmation
✗ Trade during low liquidity hours (first/last 15 min)
✗ Expect 100% accuracy (it's a confluence tool, not crystal ball)
OPTIMAL TIMEFRAMES:
• 5-minute to 1-hour charts for intraday trading
• 1-hour to 4-hour charts for swing trading
• Daily charts for position trading
BEST INSTRUMENTS:
• Major forex pairs (EUR/USD, GBP/USD, etc.)
• Index futures (ES, NQ, YM)
• High-volume stocks (SPY, QQQ, TSLA, AAPL, etc.)
• Major cryptocurrencies (BTC, ETH)
═══════════════════════════════════════════════════════════════════════
IMPORTANT DISCLAIMERS
METHODOLOGY DISCLAIMER
This indicator identifies abnormally large volume bars and estimates their directional bias based on price action and flow analysis. It does NOT have access to:
• Actual dark pool transaction data
• Off-exchange Alternative Trading System (ATS) prints
• Level 2 order book data
• Individual trade sizes or timestamps
• Institutional order identification
The prints detected are estimates based on publicly available volume and price data from TradingView. They indicate probable institutional activity patterns but are not confirmed block trades or dark pool executions.
USAGE DISCLAIMER
Block Trades is designed as a CONFLUENCE tool to validate trade setups - not as a standalone trading system. The indicator does not:
• Generate specific entry/exit signals
• Provide stop loss or take profit levels
• Constitute a complete trading strategy
• Guarantee profitable trades
Prints should be interpreted within the context of:
• Your overall trading strategy
• Market structure and trend
• Support/resistance levels
• Risk management rules
• Multiple timeframe analysis
RISK DISCLAIMER
Trading involves substantial risk of loss and is not suitable for every investor. Past performance is not indicative of future results. This indicator is a tool for technical analysis only and does NOT constitute financial advice, investment advice, trading advice, or a recommendation to buy or sell any securities or financial instruments.
You should not make any investment decision without conducting your own research and due diligence. The accuracy, completeness, and timeliness of the information provided by this indicator is not guaranteed. No representation is being made that using this indicator will guarantee profits or prevent losses.
By using this indicator, you acknowledge that you understand and accept all risks associated with trading, and you agree that the developer is not liable for any losses you may incur.
═══════════════════════════════════════════════════════════════════════
ALERTS
Available alert conditions:
• Massive Buy Print
• Massive Sell Print
• Huge Buy Print
• Huge Sell Print
• Accumulation Detected
• Distribution Detected
• High Confluence Buy (5+ points)
• High Confluence Sell (5+ points)
Happy Trading!
Accumulation_distribution

Volume–Phase Analyzer ProVolume–Phase Analyzer Pro – Trend & Institutional Volume Phases
This indicator analyzes how volume behaves relative to price movement to detect whether the market is in Accumulation, Markup, Distribution, or Markdown — the same phases institutions track in professional trading.
Unlike regular volume/MA mashups, this tool combines:
• Institutional volume classification (HighVol Up/Down, LowVol, Confused Vol)
• Price–volume efficiency and wick dominance
• Multi-Timeframe directional filters
• Volatility compression signals using Bollinger Width
• Volume mapped directly into the price chart as candles
• Smart signal engine with cooldown (prevents repeated signal spam)
This helps reveal w hen Smart Money is accumulating, pushing trends, unloading positions, or flushing liquidity.
────────────────────────────────────
How It Works
1️⃣ Volume Strength vs Average Volume
Identifies whether a move is backed by genuine buying/selling power.
2️⃣ Wick & Body Analysis
Confirms whether volume produced meaningful directional pressure — not just noise.
3️⃣ Trend Alignment
Fast EMA vs Slow EMA ensures signals align with active trend.
4️⃣ Higher-Timeframe Confirmation
Confirms if current movement agrees with a larger directional bias.
5️⃣ Compression Detection
When price volatility contracts while high-volume bars appear → phase shift often ahead.
────────────────────────────────────
Signals
BUY → Confirmed bullish demand with trend backing
SELL → Confirmed bearish supply taking control
TRAP → Likely stop-hunt or absorption — often before reversal
Signals only appear when multiple institutional conditions align.
A cooldown prevents repetitive signals like BUY-BUY-BUY.
────────────────────────────────────
Background shading helps visually locate these phases.
Markup phase:
• Meaning: Buyers are in control and the market is trending up
• Background color: Light green
Markdown phase:
• Meaning: Sellers are in control and the market is trending down
• Background color: Light red
Accumulation phase:
• Meaning: Smart Money quietly buying near the bottom before an uptrend
• Background color: Teal (blue-green)
Distribution phase:
• Meaning: Smart Money quietly selling near the top before a downtrend
• Background color: Light orange/yellow
Consolidation phase:
• Meaning: Sideways movement with low conviction
• Background color: Very light grey
Transition phase:
• Meaning: Market has not picked a direction yet
• Background color: No shading (clear background)
⸻
Quick Usage Notes
• Best trades are Buy signals during Markup and Sell signals during Markdown
• Accumulation and Distribution often come before reversals
• Consolidation is a low-quality trading zone
────────────────────────────────────
How to Trade It
• Take BUY signals during Markup
• Take SELL signals during Markdown
• Expect reversals near Trap signals, especially when phase is changing
• Avoid over-trading Consolidation zones
• Volume candles below price reveal when momentum is increasing or fading
Best applied on 5m–1H for intraday and swing confirmation.
────────────────────────────────────
Why This Indicator Is Unique
• It uses p rice-volume efficiency , not standard lagging signals
• It detects S mart Money intent , not retail reactions
• It avoids spam signals using an internal cooldown logic
• It gives context, not just entries — via live market-phase analysis
This makes it a multi-purpose tool for trend trading, breakout trading, and reversal anticipation.
────────────────────────────────────
Alerts Included
• Buy/Sell/Trap Signals
• Phase Change Alerts
────────────────────────────────────
This is a free tool and meant for educational use only.
Always use proper risk management.
────────────────────────────────────

TradeBeard Larry Williams A/D + Classic DivergenceName: TradeBeard – Larry Williams A/D + Classic Divergence
What it does:
This indicator plots a classic Larry Williams Accumulation/Distribution (A/D) line, using:
(Close−Open)/(High−Low)×Volume
It then looks at price swings vs. A/D swings and marks true Larry-style divergences:
Bull Div – Price makes a lower low, but the A/D line makes a higher low → buying pressure/accumulation.
Bear Div – Price makes a higher high, but the A/D line makes a lower high → selling pressure/distribution.
Lines are drawn between the two pivots on the A/D line, with a label at the most recent pivot.
How to use / read it:
Use on any timeframe; the logic is the same.
Look for Bull Div near potential bottoms as confirmation that smart money is quietly buying.
Look for Bear Div near potential tops as confirmation that smart money is unloading.
Settings:
Pivot left bars (price) / Pivot right bars (price)
Controls how “wide” a swing high/low must be.
1 / 1 ≈ very sensitive (ICT/Larry-style 3-bar swings).
Higher values = fewer but cleaner swings and fewer signals.
Show bullish divergences / Show bearish divergences
Turn each signal type on or off.
Bullish color (line + label) / Bearish color (line + label)
Color of the divergence lines and label background.
Bullish label text color / Bearish label text color
Text color inside the Bull Div / Bear Div labels.
That’s it: pure Larry Williams A/D flow, price-based pivots, and clean visual divergence signals, wrapped in a TradeBeard skin.
I hope this will help you in your trading.
// Disclaimer:
// This script is for educational and informational purposes only.
// Trading and investing involve risk. You are fully responsible for your own decisions,

Edufx AMD~Accumulation, Manipulation, DistributionEdufx AMD Indicator
This indicator visualizes the market cycles using distinct phases: Accumulation, Manipulation, Distribution, and Reversal. It is designed to assist traders in identifying potential entry points and understanding price behavior during these phases.
Key Features:
1. Phases and Logic:
-Accumulation Phase: Highlights the price range where market accumulation occurs.
-Manipulation Phase:
- If the price sweeps below the accumulation low, it signals a potential "Buy Zone."
- If the price sweeps above the accumulation high, it signals a potential "Sell Zone."
-Distribution Phase: Highlights where price is expected to expand and establish trends.
-Reversal Phase: Marks areas where the price may either continue or reverse.
2. Weekly and Daily Cycles:
- Toggle the visibility of Weekly Cycles and Daily Cycles independently through the settings.
- These cycles are predefined with precise timings for each phase, based on your selected on UTC-5 timezone.
3. Customizable Appearance:
- Adjust the colors for each phase directly in the settings to suit your preferences.
- The indicator uses semi-transparent boxes to represent the phases, allowing easy visualization without obstructing the chart.
4. Static Boxes:
- Boxes representing the phases are drawn only once for the visible chart range and do not dynamically delete, ensuring important consistent reference points.

CMF and Scaled EFI OverlayCMF and Scaled EFI Overlay Indicator
Overview
The CMF and Scaled EFI Overlay indicator combines the Chaikin Money Flow (CMF) and a scaled version of the Elder Force Index (EFI) into a single chart. This allows traders to analyze both indicators simultaneously, facilitating better insights into market momentum and volume dynamics , specifically focusing on buying/selling pressure and momentum , without compromising the integrity of either indicator.
Purpose
Chaikin Money Flow (CMF): Measures buying and selling pressure by evaluating price and volume over a specified period. It indicates accumulation (buying pressure) when values are positive and distribution (selling pressure) when values are negative.
Elder Force Index (EFI): Combines price changes and volume to assess the momentum behind market moves. Positive values indicate upward momentum (prices rising with strong volume), while negative values indicate downward momentum (prices falling with strong volume).
By scaling the EFI to match the amplitude of the CMF, this indicator enables a direct comparison between pressure and momentum , preserving their shapes and zero crossings. Traders can observe the relationship between price movements, volume, and momentum more effectively, aiding in decision-making.
Understanding Pressure vs. Momentum
Chaikin Money Flow (CMF):
- Indicates the level of demand (buying pressure) or supply (selling pressure) in the market based on volume and price movements.
- Accumulation: When institutional or large investors are buying significant amounts of an asset, leading to an increase in buying pressure.
- Distribution: When these investors are selling off their holdings, increasing selling pressure.
Elder Force Index (EFI):
- Measures the strength and speed of price movements, indicating how forceful the current trend is.
- Positive Momentum: Prices are rising quickly, indicating a strong uptrend.
- Negative Momentum: Prices are falling rapidly, indicating a strong downtrend.
Understanding the difference between pressure and momentum is crucial. For example, a market may exhibit strong buying pressure (positive CMF) but weak momentum (low EFI), suggesting accumulation without significant price movement yet.
Features
Overlay of CMF and Scaled EFI: Both indicators are plotted on the same chart for easy comparison of pressure and momentum dynamics.
Customizable Parameters: Adjust lengths for CMF and EFI calculations and fine-tune the scaling factor for optimal alignment.
Preserved Indicator Integrity: The scaling method preserves the shape and zero crossings of the EFI, ensuring accurate analysis.
How It Works
CMF Calculation:
- Calculates the Money Flow Multiplier (MFM) and Money Flow Volume (MFV) to assess buying and selling pressure.
- CMF is computed by summing the MFV over the specified length and dividing by the sum of volume over the same period:
CMF = (Sum of MFV over n periods) / (Sum of Volume over n periods)
EFI Calculation:
- Calculates the EFI using the Exponential Moving Average (EMA) of the price change multiplied by volume:
EFI = EMA(n, Change in Close * Volume)
Scaling the EFI:
- The EFI is scaled by multiplying it with a user-defined scaling factor to match the CMF's amplitude.
Plotting:
- Both the CMF and the scaled EFI are plotted on the same chart.
- A zero line is included for reference, aiding in identifying crossovers and divergences.
Indicator Settings
Inputs
CMF Length (`cmf_length`):
- Default: 20
- Description: The number of periods over which the CMF is calculated. A higher value smooths the indicator but may delay signals.
EFI Length (`efi_length`):
- Default: 13
- Description: The EMA length for the EFI calculation. Adjusting this value affects the sensitivity of the EFI to price changes.
EFI Scaling Factor (`efi_scaling_factor`):
- Default: 0.000001
- Description: A constant used to scale the EFI to match the CMF's amplitude. Fine-tuning this value ensures the indicators align visually.
How to Adjust the EFI Scaling Factor
Start with the Default Value:
- Begin with the default scaling factor of `0.000001`.
Visual Inspection:
- Observe the plotted indicators. If the EFI appears too large or small compared to the CMF, proceed to adjust the scaling factor.
Fine-Tune the Scaling Factor:
- Increase or decrease the scaling factor incrementally (e.g., `0.000005`, `0.00001`, `0.00005`) until the amplitudes of the CMF and EFI visually align.
- The optimal scaling factor may vary depending on the asset and timeframe.
Verify Alignment:
- Ensure that the scaled EFI preserves the shape and zero crossings of the original EFI.
- Overlay the original EFI (if desired) to confirm alignment.
How to Use the Indicator
Analyze Buying/Selling Pressure and Momentum:
- Positive CMF (>0): Indicates accumulation (buying pressure).
- Negative CMF (<0): Indicates distribution (selling pressure).
- Positive EFI: Indicates positive momentum (prices rising with strong volume).
- Negative EFI: Indicates negative momentum (prices falling with strong volume).
Look for Indicator Alignment:
- Both CMF and EFI Positive:
- Suggests strong bullish conditions with both buying pressure and upward momentum.
- Both CMF and EFI Negative:
- Indicates strong bearish conditions with selling pressure and downward momentum.
Identify Divergences:
- CMF Positive, EFI Negative:
- Buying pressure exists, but momentum is negative; potential for a bullish reversal if momentum shifts.
- CMF Negative, EFI Positive:
- Selling pressure exists despite rising prices; caution advised as it may indicate a potential bearish reversal.
Confirm Signals with Other Analysis:
- Use this indicator in conjunction with other technical analysis tools (e.g., trend lines, support/resistance levels) to confirm trading decisions.
Example Usage
Scenario 1: Bullish Alignment
- CMF Positive: Indicates accumulation (buying pressure).
- EFI Positive and Increasing: Shows strengthening upward momentum.
- Interpretation:
- Strong bullish signal suggesting that buyers are active, and the price is likely to continue rising.
- Action:
- Consider entering a long position or adding to existing ones.
Scenario 2: Bearish Divergence
- CMF Negative: Indicates distribution (selling pressure).
- EFI Positive but Decreasing: Momentum is positive but weakening.
- Interpretation:
- Potential bearish reversal; price may be rising but underlying selling pressure suggests caution.
- Action:
- Be cautious with long positions; consider tightening stop-losses or preparing for a possible trend reversal.
Tips
Adjust for Different Assets:
- The optimal scaling factor may differ across assets due to varying price and volume characteristics.
- Always adjust the scaling factor when analyzing a new asset.
Monitor Indicator Crossovers:
- Crossings above or below the zero line can signal potential trend changes.
Watch for Divergences:
- Divergences between the CMF and EFI can provide early warning signs of trend reversals.
Combine with Other Indicators:
- Enhance your analysis by combining this overlay with other indicators like moving averages, RSI, or Ichimoku Cloud.
Limitations
Scaling Factor Sensitivity:
- An incorrect scaling factor may misalign the indicators, leading to inaccurate interpretations.
- Regular adjustments may be necessary when switching between different assets or timeframes.
Not a Standalone Indicator:
- Should be used as part of a comprehensive trading strategy.
- Always consider other market factors and indicators before making trading decisions.
Disclaimer
No Guarantee of Performance:
- Past performance is not indicative of future results.
- Trading involves risk, and losses can exceed deposits.
Use at Your Own Risk:
- This indicator is provided for educational purposes.
- The author is not responsible for any financial losses incurred while using this indicator.
Code Summary
//@version=5
indicator(title="CMF and Scaled EFI Overlay", shorttitle="CMF & Scaled EFI", overlay=false)
cmf_length = input.int(20, minval=1, title="CMF Length")
efi_length = input.int(13, minval=1, title="EFI Length")
efi_scaling_factor = input.float(0.000001, title="EFI Scaling Factor", minval=0.0, step=0.000001)
// --- CMF Calculation ---
ad = high != low ? ((2 * close - low - high) / (high - low)) * volume : 0
mf = math.sum(ad, cmf_length) / math.sum(volume, cmf_length)
// --- EFI Calculation ---
efi_raw = ta.ema(ta.change(close) * volume, efi_length)
// --- Scale EFI ---
efi_scaled = efi_raw * efi_scaling_factor
// --- Plotting ---
plot(mf, color=color.green, title="CMF", linewidth=2)
plot(efi_scaled, color=color.red, title="EFI (Scaled)", linewidth=2)
hline(0, color=color.gray, title="Zero Line", linestyle=hline.style_dashed)
- Lines 4-6: Define input parameters for CMF length, EFI length, and EFI scaling factor.
- Lines 9-11: Calculate the CMF.
- Lines 14-16: Calculate the EFI.
- Line 19: Scale the EFI by the scaling factor.
- Lines 22-24: Plot the CMF, scaled EFI, and zero line.
Feedback and Support
Suggestions: If you have ideas for improvements or additional features, please share your feedback.
Support: For assistance or questions regarding this indicator, feel free to contact the author through TradingView.
---
By combining the CMF and scaled EFI into a single overlay, this indicator provides a powerful tool for traders to analyze market dynamics more comprehensively. Adjust the parameters to suit your trading style, and always practice sound risk management.

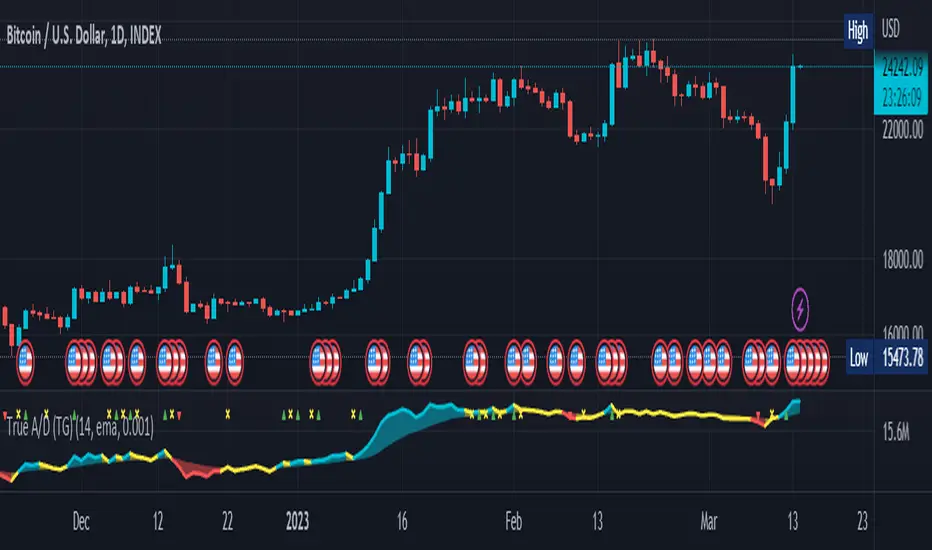
Global Net Liquidity (TG fork)Worldwide net liquidity, with trend coloring.
Global Net Liquidity attempts to represent worldwide net liquidity, and is defined as: Fed + Japan + China + UK + ECB - RRP - TGA , Where the first five components are central bank assets.
On TradingView, the indicator can be reproduced with the following equations: Global Net Liquidity = FRED:WALCL + FRED:JPNASSETS * FX_IDC:JPYUSD + CNCBBS * FX_IDC:CNYUSD + GBCBBS * FX:GBPUSD + ECBASSETSW * FX:EURUSD + RRPONTSYD + WTREGEN
However, this indicator adds a moving average cloud, and margin coloring, which eases historical trend assessment at a glance.
This indicator can be seen as an alternative representation of the accumulation/distribution indicator (and hence the same terms can be used in this description).
The Moving Average Cloud is simply the filling between the moving average (by default an EMA) and the current value. This feature was inspired by D7R ACC/DIST closed-source indicator, kudos to D7R for making such neat visual indicators.
Usage instructions:
Blue is more likely a phase of accumulation because the current value is above its historical price as defined by the moving average,
red is when this is more likely a phase of distribution.
Yellow is when the difference is below the margin, so we consider it is insignificant and that the trend is undecided. This can be disabled by setting the margin to 0.
While the color indicates if it's more likely an accumulation (blue) or distribution (red) phase or undecided (yellow), the cloud's vertical size allows to assess the strength of this tendency and the horizontal size the momentum, so that the bigger the cloud, the stronger the accumulation (if cloud is blue) or distribution (if cloud is red).
Why is that so? This is because the cloud represents the difference between the current tendency and the moving averaged past one, so a bigger cloud represents a bigger departure from recently observed tendencies. In practice, when there is accumulation, a pump in price can be expected soon, or if it already happened then it means it is indeed supported by volume, whereas if distribution, either a dump is to be expected soon, or if it already happened it means it's supported by volume.
Or maybe not necessarily a dump, but if there is a move upward in price, but the indicator indicates a strong distribution, then it means that the price movement is not supported and may not be sustainable (reversal may happen at anytime), whereas if price is going upward AND there is an accumulation (blue coloring) then it is more sustainable. This can be used to adapt strategies accordingly (risk on/risk off depending on whether there is concordance of both price and accumulation/distribution).
This indicator also includes sentiment signals that can be used to trigger alarms.
This indicator is a remix of Dharmatech's, who authored the first this Global Net Liquidity equation, kudos to them! Please show them some love if you like this indicator!

RSI Accumulation/Distribution [M]Hello everyone,
After my long tests, I observed that the rate of change of direction of the price was high after the periods when the RSI spent a long time outside the band. As a result of my observations, I prepared this indicator.
This indicator shows you the accumulation and distribution areas that occur outside the rsi band.
There are 3 different levels available.
Level 1 = 5 Bars
Level 2 = 7 Bars
Level 3 = 9 Bars
For example, if the RSI spends more than 9 bars below the 30 level or above the 70 level, it will paint that area red. Levels can be changed from the indicator settings. The rsi is smoothed with simple moving average to reduce fake signals.
Using the RSI A/D indicator with different indicators or patterns will increase your success rate.
Examples:

True Accumulation/Distribution (TG fork)An accumulation/distribution indicator that works better against gaps and with trend coloring.
Accumulation/Distribution was developed by Marc Chaikin to provide insight into strength of a trend by measuring flow of buy and sell volume .
The fact that A/D only factors current period's range for calculating the volume multiplier causes problem with price gaps. They are ignored or even misinterpreted.
True Accumulation/Distribution solves the problem by using True Range instead of only relying on current period's high and low.
Most of the time, True A/D reverts to producing the same values as the original A/D. The difference between True A/D and original A/D can be better seen when a gap has occurred, True A/D has handles it better than Accumulation/Distribution which a bearish close in period's range cause it to misinterpret the strong buy pressure as sell volume
The Moving Average Cloud is simply the filling between the moving average and the True A/D. This feature was inspired by D7R ACC/DIST closed-source indicator, kudos to D7R for making such neat visual indicators (but unfortunately all closed source!).
This indicator was made to extend the original work by adding MTF support and a moving average cloud and coloring.
If you like this indicator, please show the original author RezzaHmt some love:
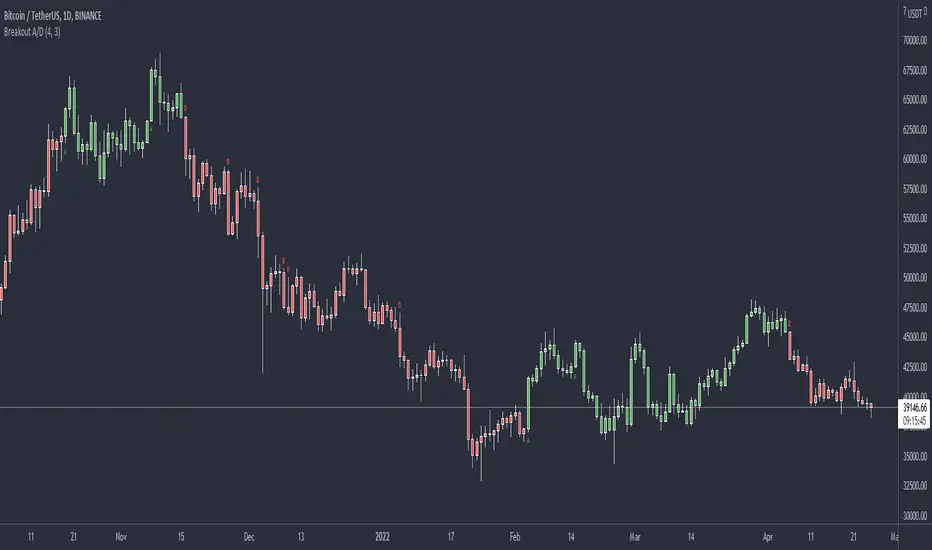
Breakout Accumulation/DistributionBasic modification of my SFP Momentum Indicator showing accumulation/distribution patterns based on breakouts above previous anchor points.
Candles are colored based on whether accumulation or distribution was last.
Best if used at HTF then confirmed at LTF.
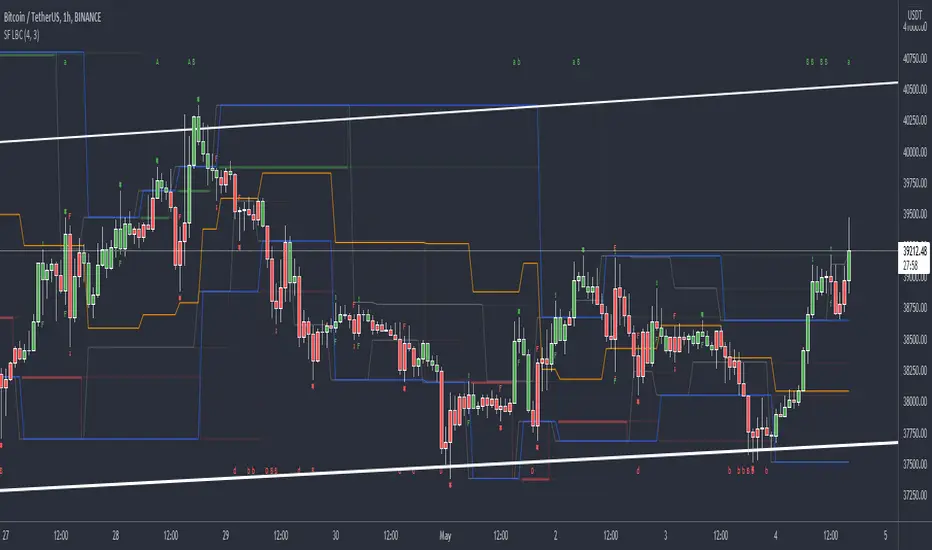
SFP MomentumCustom swing fail detector with levels and breakouts both major and minor plus colored candles based on SFP momentum.
+ Breadth & Volumenote* If you've used my "+ Rate of Change Indicator", I am updating that without the OBV, which has been moved here. Just an FYI.
This "indicator" is basically a variety of indicators that measure volume, or accumulation/distribution. There's a bit of a story about how this came about but
it's not that interesting, so I'll spare you.
Indicators from which you may choose here are On Balance Volume (OBV), Money Flow Index (MFI), Chaikin Money Flow (CMF), Chaikin Oscillator, and Positive & Negative Net Volume.
I'll give a brief overview of these below, and if you want to educate yourself further on them you may. There are many web resources for that.
Most people are probably familiar with OBV. It's one of the more commonly used volume indicators, especially in the crypto crowd (at least amongst those traders I follow). It's basically a cumulative (doesn't oscillate around a midpoint) momentum indicator that measures volume of the current period versus volume of the previous period and adds it if price closed higher, but subtracts it if price closes lower. It's another way of using volume to confirm trend.
The MFI is a momentum indicator that measures the flow of money into and out of an asset over some period of time (user input). It's calculated using the RSI, so it can be used similarly to RSI (divergences, overbought, oversold, etc.), but of course unlike the RSI it's calculated primarily using volume and comparing the most recent candle close to the previous one (similar to OBV).
CMF is a volume-weighted average of accumulation and distribution over a some period of time (typically 21). It's a way of measuring accumulation versus
distribution in an asset, and oscillates around a zero line. You would use it similarly to any other oscillator, in that you can look for divergences, and general positive or negative momentum.
Chaikin Oscillator is basically a MACD (without signal line) of the accumulation and distribution index (or line--which is somehow different than simply accumulation and distribution). I haven't looked into these differences deeply, but if you look below at the calculations, and substituted 'ad' for 'accdist' you get very different readings. I actually did that, and what it looks like it would do is turn the actual Oscillator into a MACD signal line. So, by substituting 'ad' for 'accdist' (or the accumulation/distribution index) you produce a signal line of the Chaikin Oscillator.
Anyway, all that confusion out of the way, as I said, it's a MACD on the accumulation and distribution index, therefore it is another zero line oscillator, and similarly to CMF, it's a way of measuring price movements in the chart versus a/d. The zero line isn't just any old zero line, however, it is actually the accumulation distribution line. I've made an OBV version of this by substituting the OBV for AD, so if you prefer OBV maybe you will like that.
Pos. & Neg Net Volume is actually an indicator I had seen made by RafaelZioni. It basically takes net volume, calculates a cumulative of that, then subtracts a moving average of some period from the cumulative net volume in order to create a volume oscillator. Use it like the other oscillators!
Added Donchian Channels, moving averages, Bollinger Bands, colored everything, and alerts.
Enjoy!
Below I will post images with the different indicators, everything on default settings (except for lookback period, which I have adjusted to my personal preferences).
Above is an image with the MFI being compared to the RSI since they are very similar (MFI being basically a volume derivative of the RSI).
Chaikin Money Flow set to lookback of 13. You could probably extend that a bit if you wanted to smooth the line more.
Chaikin Oscillator and Chaikin Oscillator of OBV, with a zoomed in look below, to see the differences more clearly.
CO and COBV closer look.
Positive & Negative Net Volume.

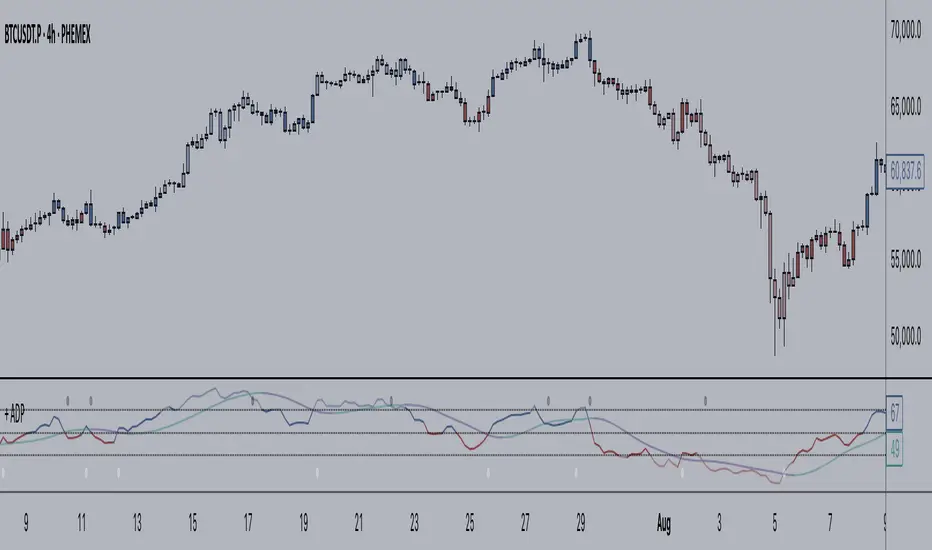
+ Accumulation/DistributionThis is an updated version (with lots of extras added) of the Accumulation/Distribution indicator coded by @Cl8DH.
You can read about what he says about his indicator, and how to use it, here:
So, from that, what have I done?
I added a moving average (of which there are many types to choose from) so that you can use this as a "two lines cross" indicator, as well as a "mid-line cross" indicator.
I added Bollinger Bands (primarily for when "range" is turned off, but if you want to use the Bands with it in fixed range mode too, that's fine. You do you.).
I added candle coloring for both ways of using this indicator:
In rangebound mode there is overbought and oversold coloring, as well as bullish (ADP above the MA and median) and bearish (ADP below the MA and median), and neutral (ADP is above the MA but below the median, or below the MA and above the median). With range turned off there is no overbought or oversold of course. Above the MA and median is bullish, below both is bearish, and neutral covers that grey area where it's neither one nor the other.
The indicator itself is also colored in the same way the candles are. The MA and BBands are biased colored as well (green/red).
Alerts for pretty much every condition imaginable.
Please note in the image above the indicator is pretty gaudy. I don't use it like that, and you can turn a lot of that stuff off (lines, shading, etc.). That is just the default settings.
Like I said, I think Bollinger Bands make most sense if you have it set to range off, but they could be useful either way. Depends on you, the trader.
The candle color is 100% based on the moving average, so if you are using the BBands, set your MA to the default 20 SMA because that's what BBands use for the basis. If you just turn off the MA, whatever it is set to the indicator will still see that and use it (unless you turn off candle colors) to color the candles.
Above is the same image, but just with range turned off, and the Bollinger Bands turned off.
That's all. Hope you like this! It's becoming a favorite of mine, and a lot of what I've implemented here will be added to my previously released indicators, as well as any new ones.
A/D Indicator[wozdux]+sum1 sum2 sum3Accumulation Distribution indicator (A / D) with additions. By default, the summation is performed for the entire historical period or for the period for which data are available on the Tradingwiev website . Added the ability to summarize for a given period (sum1, sum2,sum3).
--------
Accumulation Distribution индикатор (A/D) c дополнениями. По умолчанию суммирование производится за весь исторический период или за тот период, за который имеются данные на сайте Tradingwiev . Добавлена возможность суммировать за заданный период (sum1, sum2,sum3).
Fib,Guppy Multiple MA(FGMMA)(A/D & Volume Weight,SMA,EMA)[cI8DH]Features:
- 3 + 12 MAs (12 is chosen because Guppy has 12 MAs)
- MA types can be set to Simple, Exponential, Weighted, and Smoothed
- Volume weight can be applied to all available MAs (the built-in VWMA uses Simple MA)
- It is possible to count in only effective portions of the volume in the equation by using Accum/Dist Volume Weight
- Secondary smoothing (useful when volume weight is enabled)
- Predefined MA sets based on Fibonacci sequence (2,3,5,8,.., 377), Guppy (3,5,8,10,12,15 &30,35,40,45,50,60), and cI8DH (2,3,5,8,12,17 & 30,34,39,45,52,60)
Recommended settings:
- hlc3 as input source captures all the essential information encapsulated in a candle. I'd use hlc3 as the default option. In uptrend, "low" and in downtrend, "high" might give more relevant results when using MAs for structural analysis of a market. For commonly used MAs (EMA20, SMA50,100,200), "close" should be used due to their self-fulfilling prophecy effect.
- When you have volume weight above 0, you may want to use secondary smoothing.
- Try not to use Simple MA for smaller lengths (below 20). Sharp changes in the past (right before the period specified by the length) will affect the current value of MA dramatically leading to confusion.
- I am using the first 3 MAs for SMA 50,100,200. You can disable them from the MA type selector all at once when using Fib or Guppy ribbons.
MA-based analysis:
There are different ways of structuring a market. Geometrical (trend lines, channels, fans, patterns, etc) and Fib retracement-based structuring is very common among traders. MAs give an alternative way of analyzing markets. MA ribbons such as Guppy (6 slow and 6 fast-moving MAs) are popular for analyzing market flow. IMO default Guppy sets are a bit random as the numbers do not have an elegant sequence. So I proposed my sets based on increasing sequene spacing (+1). These two MA ribbons are good for market flow analysis but the spacing of the MAs are not ideal for structuring a market. Ribbons based on the Fib sequence is a better choice for structuring a market. This is the equivalent of Fib channels but in a more dynamic form. Among other things, MA Fib ribbon can be used to assess market momentum and to compare different stages of a market. Here are two "educational-only" examples:
Notes:
- Smoothed MA with length L = Exponential MA with length 2*L-1
- Read the background section in my ADP indicator to understand how A/D Volume is calculated
