Volume Weighted Relative Strength IndexThis indicator calculates the Relative Strength Index (RSI) and enhances it with optional volume weighting (VWRSI). It also includes a customizable signal line and a built-in divergence detection engine.
Key Features:
Volume-Weighted Calculation: An option (Volume weighted) allows for volume to be incorporated into the calculation of both the RSI itself and its moving average signal line, making the oscillator more sensitive to high-volume price changes.
Customizable Signal Line: Includes an optional moving average of the VWRSI, which serves as a signal line. The type of MA (Smooth Method) and its length can be customized.
Full Divergence Suite (Class A, B, C): The primary feature is the integrated divergence engine. It automatically detects and plots all three major types of divergences:
Regular (A): Signals potential trend reversals.
Hidden (B): Signals potential trend continuations.
Exaggerated (C): Signals weakness at double tops/bottoms.
Divergence Filtering and Visualization:
Price Tolerance Filter: Divergence detection is enhanced with a percentage-based price tolerance (pivPrcTol) to filter out insignificant market noise.
Persistent Visualization: Divergence markers are plotted for the entire duration of the signal and are visually anchored to the VWRSI level of the confirming pivot.
Note on Confirmation (Lag): Divergence signals rely on a pivot confirmation method to ensure they do not repaint.
The Start of a- divergence is only detected after the confirming pivot is fully formed (a delay based on Pivot Right Bars).
The End of a divergence is detected either instantly (if the signal is invalidated by price action) or with a delay (when a new, non-divergent pivot is confirmed).
Multi-Timeframe (MTF) Capability:
MTF VWRSI Line: The VWRSI and its signal line can be calculated on a higher timeframe, with standard options to handle gaps (Fill Gaps) and prevent repainting (Wait for...).
Limitation: The Divergence detection engine (pivDiv) is disabled if a timeframe other than the chart's timeframe is selected. Divergences are only calculated on the active chart timeframe.
Integrated Alerts: Includes 20 comprehensive alerts for:
The start and end of all 6 divergence types.
The VWRSI crossing its signal line.
The VWRSI crossing the Overbought, Oversold, or 50-level lines.
DISCLAIMER
For Informational/Educational Use Only: This indicator is provided for informational and educational purposes only. It does not constitute financial, investment, or trading advice, nor is it a recommendation to buy or sell any asset.
Use at Your Own Risk: All trading decisions you make based on the information or signals generated by this indicator are made solely at your own risk.
No Guarantee of Performance: Past performance is not an indicator of future results. The author makes no guarantee regarding the accuracy of the signals or future profitability.
No Liability: The author shall not be held liable for any financial losses or damages incurred directly or indirectly from the use of this indicator.
Signals Are Not Recommendations: The alerts and visual signals (e.g., crossovers) generated by this tool are not direct recommendations to buy or sell. They are technical observations for your own analysis and consideration.
Alert

Relative Distance to Moving AverageThis indicator calculates the Relative Distance to a Moving Average (RDMA), a momentum oscillator that measures how overextended a price is from its moving average baseline. It expresses this distance as a percentage, oscillating around a zero line. High positive values may indicate overbought conditions, while large negative values may suggest oversold conditions.
Key Features:
Customizable MA Baseline: The oscillator's baseline is a moving average. Users can select from a wide range of MA types (e.g., EMA, SMA, WMA) and apply volume weighting (Volume weighted) for enhanced responsiveness.
Normalization (Geometric Average): Includes an optional 'Normalize' mode. When enabled, the indicator uses a Geometric Moving Average (GMA) as its baseline and measures the percentage distance from this compound growth average, making it suitable for exponential markets.
Full Divergence Suite (Class A, B, C): The indicator's primary feature is its integrated divergence engine. It automatically detects and plots all three major divergence classes between price and the RDMA:
Regular (A): Signals potential trend exhaustion and reversals.
Hidden (B): Signals potential trend continuations during pullbacks.
Exaggerated (C): Signals weakness at double tops/bottoms.
Divergence Filtering and Visualization:
Price Tolerance Filter: Divergence detection is enhanced with a percentage-based price tolerance (pivPrcTol) to filter out insignificant market noise.
Persistent Visualization: Divergence markers are plotted for the entire duration of the signal and are visually anchored to the RDMA level of the confirming pivot.
Note on Confirmation (Lag): Divergence signals rely on a pivot confirmation method to ensure they do not repaint.
The Start of a- divergence is only detected after the confirming pivot is fully formed (a delay based on Pivot Right Bars).
The End of a divergence is detected either instantly (if the signal is invalidated by price action) or with a delay (when a new, non-divergent pivot is confirmed).
Multi-Timeframe (MTF) Capability:
MTF RDMA Line: The RDMA oscillator itself can be calculated on a higher timeframe, with standard options to handle gaps (Fill Gaps) and prevent repainting (Wait for...).
Limitation: The Divergence detection engine (pivDiv) is disabled if a timeframe other than the chart's timeframe is selected. Divergences are only calculated on the active chart timeframe.
Integrated Alerts: Includes 14 comprehensive alerts for:
The start and end of all 6 divergence types.
The RDMA oscillator crossing the zero line.
DISCLAIMER
For Informational/Educational Use Only: This indicator is provided for informational and educational purposes only. It does not constitute financial, investment, or trading advice, nor is it a recommendation to buy or sell any asset.
Use at Your Own Risk: All trading decisions you make based on the information or signals generated by this indicator are made solely at your own risk.
No Guarantee of Performance: Past performance is not an indicator of future results. The author makes no guarantee regarding the accuracy of the signals or future profitability.
No Liability: The author shall not be held liable for any financial losses or damages incurred directly or indirectly from the use of this indicator.
Signals Are Not Recommendations: The alerts and visual signals (e.g., crossovers) generated by this tool are not direct recommendations to buy or sell. They are technical observations for your own analysis and consideration.

Chaikin Money FlowThis indicator provides an implementation of the classic Chaikin Money Flow (CMF), a volume-weighted oscillator designed to measure money flow pressure. It is enhanced with a customizable signal line and a built-in divergence detection engine.
Key Features:
Full Divergence Suite (Class A, B, C): The primary feature is the integrated divergence engine. It automatically detects and plots all three major types of divergences:
Regular (A): Signals potential trend reversals.
Hidden (B): Signals potential trend continuations.
Exaggerated (C): Signals weakness at double tops/bottoms.
Divergence Filtering and Visualization:
Price Tolerance Filter: Divergence detection is enhanced with a percentage-based price tolerance (pivPrcTol) to filter out insignificant market noise, leading to more robust signals.
Persistent Visualization: Divergence markers are plotted for the entire duration of the signal and are visually anchored to the CMF level of the confirming pivot.
Customizable Signal Line: Includes an optional moving average of the CMF, which serves as a signal line. The type of MA (Signal Smoothing) and its length can be customized. This signal line can also be optionally volume-weighted (Volume weighted).
Note on Confirmation (Lag): Divergence signals rely on a pivot confirmation method to ensure they do not repaint.
The Start of a- divergence is only detected after the confirming pivot is fully formed (a delay based on Pivot Right Bars).
The End of a divergence is detected either instantly (if the signal is invalidated by price action) or with a delay (when a new, non-divergent pivot is confirmed).
Multi-Timeframe (MTF) Capability:
MTF CMF & Signal Lines: The CMF and its signal line can be calculated on a higher timeframe, with standard options to handle gaps (Fill Gaps) and prevent repainting (Wait for...).
Limitation: The Divergence detection engine (pivDiv) is disabled if a timeframe other than the chart's timeframe is selected. Divergences are only calculated on the active chart timeframe.
Integrated Alerts: Includes 16 comprehensive alerts for:
The start and end of all 6 divergence types.
The CMF crossing its signal line.
The CMF crossing the zero line.
DISCLAIMER
For Informational/Educational Use Only: This indicator is provided for informational and educational purposes only. It does not constitute financial, investment, or trading advice, nor is it a recommendation to buy or sell any asset.
Use at Your Own Risk: All trading decisions you make based on the information or signals generated by this indicator are made solely at your own risk.
No Guarantee of Performance: Past performance is not an indicator of future results. The author makes no guarantee regarding the accuracy of the signals or future profitability.
No Liability: The author shall not be liable for any financial losses or damages incurred directly or indirectly from the use of this indicator.
Signals Are Not Recommendations: The alerts and visual signals (e.g., crossovers) generated by this tool are not direct recommendations to buy or sell. They are technical observations for your own analysis and consideration.

Accumulation Distribution LineThis indicator provides an implementation of the classic Accumulation/Distribution Line (ADL). It enhances the standard indicator with a built-in divergence detection engine.
Key Features:
Full Divergence Suite (Class A, B, C): The primary feature is the integrated divergence engine. It automatically detects and plots all three major types of divergences:
Regular (A): Signals potential trend reversals.
Hidden (B): Signals potential trend continuations.
Exaggerated (C): Signals weakness at double tops/bottoms.
Divergence Filtering and Visualization:
Price Tolerance Filter: Divergence detection is enhanced with a percentage-based price tolerance (pivPrcTol) to filter out insignificant market noise, leading to more robust signals.
Persistent Visualization: Divergence markers are plotted for the entire duration of the signal and are visually anchored to the ADL level of the confirming pivot.
Note on Confirmation (Lag): Divergence signals rely on a pivot confirmation method to ensure they do not repaint.
The Start of a- divergence is only detected after the confirming pivot is fully formed (a delay based on Pivot Right Bars).
The End of a divergence is detected either instantly (if the signal is invalidated by price action) or with a delay (when a new, non-divergent pivot is confirmed).
Multi-Timeframe (MTF) Capability:
MTF ADL Line: The ADL line itself can be calculated on a higher timeframe, with standard options to handle gaps (Fill Gaps) and prevent repainting (Wait for...).
Limitation: The Divergence detection engine (pivDiv) is disabled if a timeframe other than the chart's timeframe is selected. Divergences are only calculated on the active chart timeframe.
Integrated Alerts: Includes 12 comprehensive alerts that trigger on the start and end of all 6 divergence types (e.g., "Regular Bullish Started", "Regular Bullish Ended").
DISCLAIMER
For Informational/Educational Use Only: This indicator is provided for informational and educational purposes only. It does not constitute financial, investment, or trading advice, nor is it a recommendation to buy or sell any asset.
Use at Your Own Risk: All trading decisions you make based on the information or signals generated by this indicator are made solely at your own risk.
No Guarantee of Performance: Past performance is not an indicator of future results. The author makes no guarantee regarding the accuracy of the signals or future profitability.
No Liability: The author shall not be held liable for any financial losses or damages incurred directly or indirectly from the use of this indicator.
Signals Are Not Recommendations: The alerts and visual signals (e.g., crossovers) generated by this tool are not direct recommendations to buy or sell. They are technical observations for your own analysis and consideration.

On Balance VolumeThis indicator provides an implementation of the classic On Balance Volume (OBV) momentum indicator, enhanced with a built-in divergence detection engine.
Key Features:
Full Divergence Suite (Class A, B, C): The primary feature is the integrated divergence engine. It automatically detects and plots all three major types of divergences:
Regular (A): Signals potential trend reversals.
Hidden (B): Signals potential trend continuations.
Exaggerated (C): Signals weakness at double tops/bottoms.
Divergence Filtering and Visualization:
Price Tolerance Filter: Divergence detection is enhanced with a percentage-based price tolerance (pivPrcTol) to filter out insignificant market noise, leading to more robust signals.
Persistent Visualization: Divergence markers are plotted for the entire duration of the signal and are visually anchored to the OBV level of the confirming pivot.
Note on Confirmation (Lag): Divergence signals rely on a pivot confirmation method to ensure they do not repaint.
The Start of a- divergence is only detected after the confirming pivot is fully formed (a delay based on Pivot Right Bars).
The End of a divergence is detected either instantly (if the signal is invalidated by price action) or with a delay (when a new, non-divergent pivot is confirmed).
Multi-Timeframe (MTF) Capability:
MTF OBV Line: The OBV line itself can be calculated on a higher timeframe, with standard options to handle gaps (Fill Gaps) and prevent repainting (Wait for...).
Limitation: The Divergence detection engine (pivDiv) is disabled if a timeframe other than the chart's timeframe is selected. Divergences are only calculated on the active chart timeframe.
Integrated Alerts: Includes 12 comprehensive alerts that trigger on the start and end of all 6 divergence types (e.g., "Regular Bullish Started", "Regular Bullish Ended").
DISCLAIMER
For Informational/Educational Use Only: This indicator is provided for informational and educational purposes only. It does not constitute financial, investment, or trading advice, nor is it a recommendation to buy or sell any asset.
Use at Your Own Risk: All trading decisions you make based on the information or signals generated by this indicator are made solely at your own risk.
No Guarantee of Performance: Past performance is not an indicator of future results. The author makes no guarantee regarding the accuracy of the signals or future profitability.
No Liability: The author shall not be held liable for any financial losses or damages incurred directly or indirectly from the use of this indicator.
Signals Are Not Recommendations: The alerts and visual signals (e.g., crossovers) generated by this tool are not direct recommendations to buy or sell. They are technical observations for your own analysis and consideration.

Market Structure Pivots TrendThis indicator identifies and visualizes key market structure by plotting confirmed, non-repainting pivot points. It goes beyond simple markers by classifying the pivots, extending dynamic support/resistance lines, and providing a visual representation of the current trend state.
Key Features:
Non-Repainting Pivot Detection:
Uses a standard lookback method (left and right bars) to identify historical pivot points.
Note on Confirmation: Pivots are only confirmed after the Pivot Right Bars input has passed. This is essential for ensuring the signal is non-repainting, but it introduces an inherent lag.
Automatically classifies the sequence of pivots according to Dow Theory: Higher Highs (HH), Higher Lows (HL), Lower Highs (LH), and Lower Lows (LL).
Pivot Classification Filter:
Price Tolerance Filter: A user-defined percentage tolerance filters out insignificant market noise. A pivot is only classified as 'Higher' or 'Lower' if its price exceeds the previous one by more than the set tolerance, leading to more robust signals.
Equal Pivot Detection: The tolerance also enables the detection of Equal Highs (EH) and Equal Lows (EL), highlighting consolidation zones.
Dynamic Support & Resistance Lines:
When enabled, the indicator extends a horizontal line from the most recent confirmed pivot high and low.
These lines update in real-time, providing clear S/R levels.
Lines automatically terminate if the price decisively breaks through them or if a new pivot of the same type is formed.
Trend State Visualization:
A built-in state machine analyzes the sequence of pivots and breaks to determine the current market trend (Uptrend, Downtrend, or Neutral).
Plots a dynamic step-line based on recent highs/lows to visually represent the current trend state.
Full Customization & Alerts:
Display Options: Choose between simple triangles or detailed text labels that show the pivot type, price, and the absolute or relative change from the previous pivot of the same type.
Visual Styling: Full control over colors for all six pivot types (HH, LH, EH, LL, HL, EL) and line styles.
Comprehensive Alerts: Set up alerts for every new pivot formation (e.g., HH, LL), for S/R line breaks, and for changes in the overall trend state (Up, Down, Neutral).
DISCLAIMER
For Informational/Educational Use Only: This indicator is provided for informational and educational purposes only. It does not constitute financial, investment, or trading advice, nor is it a recommendation to buy or sell any asset.
Use at Your Own Risk: All trading decisions you make based on the information or signals generated by this indicator are made solely at your own risk.
No Guarantee of Performance: Past performance is not an indicator of future results. The author makes no guarantee regarding the accuracy of the signals or future profitability.
No Liability: The author shall not be held liable for any financial losses or damages incurred directly or indirectly from the use of this indicator.
Signals Are Not Recommendations: The alerts and visual signals (e.g., crossovers) generated by this tool are not direct recommendations to buy or sell. They are technical observations for your own analysis and consideration.

Volume Weighted Average PriceThis indicator provides an implementation of the Volume Weighted Average Price (VWAP), extended with layered standard deviation bands that decompose total market volatility relative to the VWAP anchor period.
Key Features:
Volatility Decomposition: The indicator's primary feature is its ability to separate volatility, controlled by the 'Estimate Bar Statistics' option.
Standard Mode (Estimate Bar Statistics = OFF): Plots a single set of bands representing the standard deviation of the Source price relative to the VWAP.
Decomposition Mode (Estimate Bar Statistics = ON): The indicator uses a statistical model ('Estimator') to calculate within-bar volatility. (Assumption: In this mode, the Source input is ignored, and an estimated mean for each bar is used instead). This mode displays two sets of bands:
Inner Bands: Show only the contribution of the 'between-bar' volatility.
Outer Bands: Show the total volatility (the sum of between-bar and within-bar components).
Periodic & Customizable Anchor: The VWAP calculation is session-based and resets at the beginning of a new period. The anchor timeframe (Anchor Timeframe) can be detected automatically (e.g., 'Session', 'Week') or specified manually.
Weighting Mechanism: The indicator has two levels of weighting:
The baseline is always a VWAP (Volume-Weighted Average Price).
The Volume weighted input additionally applies volume weighting to the volatility (standard deviation) calculation for the bands.
Multi-Timeframe (MTF) Engine: The indicator includes an MTF conversion block. When a Higher Timeframe (HTF) is selected, advanced options become available: Fill Gaps handles data gaps, and Wait for timeframe to close prevents repainting by ensuring the indicator only updates when the HTF bar closes.
Integrated Alerts: Includes a full set of built-in alerts for the source price crossing over or under the central VWAP line and the outermost calculated volatility band.
DISCLAIMER
For Informational/Educational Use Only: This indicator is provided for informational and educational purposes only. It does not constitute financial, investment, or trading advice, nor is it a recommendation to buy or sell any asset.
Use at Your Own Risk: All trading decisions you make based on the information or signals generated by this indicator are made solely at your own risk.
No Guarantee of Performance: Past performance is not an indicator of future results. The author makes no guarantee regarding the accuracy of the signals or future profitability.
No Liability: The author shall not be held liable for any financial losses or damages incurred directly or indirectly from the use of this indicator.
Signals Are Not Recommendations: The alerts and visual signals (e.g., crossovers) generated by this tool are not direct recommendations to buy or sell. They are technical observations for your own analysis and consideration.

Volume Weighted Linear Regression BandThe Volume-Weighted Linear Regression Band (VWLRBd) is a volatility channel that uses a Linear Regression line as its dynamic baseline. Its primary feature is the decomposition of total volatility into two distinct components, visualized as layered bands.
Key Features:
Volatility Decomposition: The indicator separates volatility based on the 'Estimate Bar Statistics' option.
Standard Mode (Estimate Bar Statistics = OFF): The indicator functions as a standard (Volume-Weighted) Linear Regression Channel. It plots a single set of bands based on the standard deviation of the residuals (the error between the Source price and the regression line).
Decomposition Mode (Estimate Bar Statistics = ON): The indicator uses a statistical model ('Estimator') to calculate within-bar volatility. (Assumption: In this mode, the Source input is ignored, and an estimated mean for each bar is used for the regression). This mode displays two sets of bands:
Inner Bands: Show only the contribution of the 'residual' (trend noise) volatility, calculated proportionally.
Outer Bands: Show the total volatility (the sum of residual and within-bar components).
Regression Baseline (Linear / Exponential): The central line is a (Volume-Weighted) Linear Regression curve. An optional 'Normalize' mode performs all calculations in logarithmic space, transforming the baseline into an Exponential Regression Curve and the bands into constant percentage deviations, suitable for analyzing growth assets.
Volume Weighting: An option (Volume weighted) allows for volume to be incorporated into the calculation of both the regression baseline and the volatility decomposition, giving more influence to high-participation bars.
Multi-Timeframe (MTF) Engine: The indicator includes an MTF conversion block. When a Higher Timeframe (HTF) is selected, advanced options become available: Fill Gaps handles data gaps, and Wait for timeframe to close prevents repainting by ensuring the indicator only updates when the HTF bar closes.
Integrated Alerts: Includes a full set of built-in alerts for the source price crossing over or under the central regression line and the outermost calculated volatility band.
DISCLAIM_
For Informational/Educational Use Only: This indicator is provided for informational and educational purposes only. It does not constitute financial, investment, or trading advice, nor is it a recommendation to buy or sell any asset.
Use at Your Own Risk: All trading decisions you make based on the information or signals generated by this indicator are made solely at your own risk.
No Guarantee of Performance: Past performance is not an indicator of future results. The author makes no guarantee regarding the accuracy of the signals or future profitability.
No Liability: The author shall not be held liable for any financial losses or damages incurred directly or indirectly from the use of this indicator.
Signals Are Not Recommendations: The alerts and visual signals (e.g., crossovers) generated by this tool are not direct recommendations to buy or sell. They are technical observations for your own analysis and consideration.

Volume Weighted Linear Regression ChannelThis indicator plots a dynamic channel around a Linear Regression trendline. It provides a framework for identifying the prevailing trend and assessing price extremes based on volatility.
Key Features:
Linear Regression Baseline: The channel's centerline is a (Volume-Weighted) Linear Regression line. This line represents the 'best fit' for the recent price action, serving as a responsive baseline for the trend.
Volatility Decomposition: The indicator's primary feature is its ability to decompose volatility, controlled by the 'Estimate Bar Statistics' option.
Standard Mode (Estimate Bar Statistics = OFF): Calculates a standard linear regression channel. The bands represent the standard deviation of the residuals (the error) between the Source price and the regression line.
Decomposition Mode (Estimate Bar Statistics = ON): The indicator uses a statistical model ('Estimator') to calculate within-bar volatility. (Assumption: In this mode, the Source input is ignored, and an estimated mean for each bar is used for the regression). This mode displays two sets of bands:
Inner Bands: Show only the contribution of the 'residual' (trend noise) volatility, calculated proportionally.
Outer Bands: Show the total volatility (the sum of residual and within-bar components).
Volume Weighting: An option (Volume weighted) allows for volume to be incorporated into the calculation of both the linear regression and the volatility decomposition, giving more influence to high-participation bars.
Trend Projection: The calculated channel is plotted as a projection, which can be extended forward (Extend Forward) and backward (Extend Backward) in time to provide a visual guide for potential support and resistance.
Integrated Alerts: Includes a full set of built-in alerts for the Source price crossing over or under the calculated upper band, lower band, and the central regression line.
DISCLAIMER
For Informational/Educational Use Only: This indicator is provided for informational and educational purposes only. It does not constitute financial, investment, or trading advice, nor is it a recommendation to buy or sell any asset.
Use at Your Own Risk: All trading decisions you make based on the information or signals generated by this indicator are made solely at your own risk.
No Guarantee of Performance: Past performance is not an indicator of future results. The author makes no guarantee regarding the accuracy of the signals or future profitability.
No Liability: The author shall not be held liable for any financial losses or damages incurred directly or indirectly from the use of this indicator.
Signals Are Not Recommendations: The alerts and visual signals (e.g., crossovers) generated by this tool are not direct recommendations to buy or sell. They are technical observations for your own analysis and consideration.

Volume Weighted Bollinger BandsThis indicator provides a customizable version of Bollinger Bands, enhanced with optional volume weighting and a method for decomposing market volatility.
Key Features:
Volatility Decomposition: The indicator's primary feature is its ability to separate total volatility, controlled by the 'Estimate Bar Statistics' option.
Standard Mode (Estimate Bar Statistics = OFF): The indicator functions as a customizable Bollinger Band. It calculates the standard deviation of the user-selected Source and plots a single set of bands.
Decomposition Mode (Estimate Bar Statistics = ON): The indicator uses a statistical model ('Estimator') to calculate within-bar volatility. (Assumption: In this mode, the Source input is ignored, and an estimated mean for each bar is used instead). This mode displays two sets of bands:
Inner Bands: Show only the contribution of the 'between-bar' volatility.
Outer Bands: Show the total volatility (the sum of between-bar and within-bar components).
Customizable Construction: The indicator is a hybrid:
Basis Line: The central line is calculated using a selectable Moving Average type (e.g., EMA, SMA, WMA).
Volume Weighting: An option (Volume weighted) allows for volume to be incorporated into the calculation of both the basis MA and the volatility decomposition.
Logarithmic Scaling: An optional 'Normalize' mode calculates the bands on a logarithmic scale. This results in bands that maintain a constant percentage distance from the basis, suitable for analyzing exponential markets.
Multi-Timeframe (MTF) Engine: The indicator includes an MTF conversion block. When a Higher Timeframe (HTF) is selected, advanced options become available: Fill Gaps handles data gaps, and Wait for timeframe to close prevents repainting by ensuring the indicator only updates when the HTF bar closes.
Integrated Alerts: Includes a full set of built-in alerts for the source price crossing over or under the central MA line and the outermost calculated volatility band.
DISCLAIMER
For Informational/Educational Use Only: This indicator is provided for informational and educational purposes only. It does not constitute financial, investment, or trading advice, nor is it a recommendation to buy or sell any asset.
Use at Your Own Risk: All trading decisions you make based on the information or signals generated by this indicator are made solely at your own risk.
No Guarantee of Performance: Past performance is not an indicator of future results. The author makes no guarantee regarding the accuracy of the signals or future profitability.
No Liability: The author shall not be held liable for any financial losses or damages incurred directly or indirectly from the use of this indicator.
Signals Are Not Recommendations: The alerts and visual signals (e.g., crossovers) generated by this tool are not direct recommendations to buy or sell. They are technical observations for your own analysis and consideration.

Volume Weighted Keltner ChannelThis indicator provides a customizable implementation of Keltner Channels (KC), a volatility-based envelope designed to identify trend direction and potential reversal or breakout zones. It allows deep control over its core components and calculation methods.
Key Features:
Customizable Components: This implementation allows for full control over the channel's construction:
Basis Line: Choose from a wide range of moving average types (e.g., EMA, SMA, WMA) for the central line.
Volatility Bands: Select the volatility measure used to construct the bands: Average True Range (ATR), True Range (TR), or bar Range (High-Low).
Volume Weighting: An option (Volume weighted) allows for volume to be incorporated into the calculation of both the basis moving average and the selected volatility measure (e.g., creating a Volume-Weighted ATR). This makes the channel more responsive to moves backed by high market participation.
Logarithmic Scaling: The indicator includes an optional 'Normalize' mode that calculates the channel on a logarithmic scale. This creates bands that represent a constant percentage distance from the basis, making it a suitable tool for analyzing long-term trends in exponential markets.
Multi-Timeframe (MTF) Engine: The indicator includes an MTF conversion block. When a Higher Timeframe (HTF) is selected, advanced options become available: Fill Gaps handles data gaps, and Wait for timeframe to close prevents repainting by ensuring the indicator only updates when the HTF bar closes.
Integrated Alerts: Includes a full set of built-in alerts for the source price crossing over or under the upper band, lower band, and the central basis line.
DISCLAIMER
For Informational/Educational Use Only: This indicator is provided for informational and educational purposes only. It does not constitute financial, investment, or trading advice, nor is it a recommendation to buy or sell any asset.
Use at Your Own Risk: All trading decisions you make based on the information or signals generated by this indicator are made solely at your own risk.
No Guarantee of Performance: Past performance is not an indicator of future results. The author makes no guarantee regarding the accuracy of the signals or future profitability.
No Liability: The author shall not be held liable for any financial losses or damages incurred directly or indirectly from the use of this indicator.
Signals Are Not Recommendations: The alerts and visual signals (e.g., crossovers) generated by this tool are not direct recommendations to buy or sell. They are technical observations for your own analysis and consideration.

Versatile Moving AverageThe Versatile Moving Average (VMA) is a comprehensive, all-in-one tool for trend analysis. It is designed to act as a central hub for advanced MA calculations by combining a wide selection of average types, calculation modes, and a multi-timeframe engine.
Key Features:
Comprehensive MA Selection: Provides a wide variety of moving average types (e.g., EMA, SMA, WMA, HMA, and their volume-weighted counterparts). Allows full customization of length, source, and offset.
Advanced Calculation Modes:
Volume Weighting: Optionally weights the selected MA calculation by volume, making it more responsive to market participation.
Normalization (Geometric Average): A key feature is the optional 'Normalize' mode. When enabled, the indicator calculates a Geometric Moving Average by averaging the logarithms of the source price. This measures the average compound growth rate, making it well-suited for analyzing assets with exponential price behavior.
Multi-Timeframe (MTF) Engine: The indicator includes an MTF conversion block. When a Higher Timeframe (HTF) is selected, advanced options become available: Fill Gaps handles data gaps, and Wait for timeframe to close prevents repainting by ensuring the indicator only updates when the HTF bar closes.
Integrated Alerts: Comes with built-in alerts for the source price crossing over or under the calculated VMA, allowing for timely notifications.
DISCLAIMER
For Informational/Educational Use Only: This indicator is provided for informational and educational purposes only. It does not constitute financial, investment, or trading advice, nor is it a recommendation to buy or sell any asset.
Use at Your Own Risk: All trading decisions you make based on the information or signals generated by this indicator are made solely at your.
No Guarantee of Performance: Past performance is not an indicator of future results. The author makes no guarantee regarding the accuracy of the signals or future profitability.
No Liability: The author shall not be held liable for any financial losses or damages incurred directly or indirectly from the use of this indicator.
Signals Are Not Recommendations: The alerts and visual signals (e.g., crossovers) generated by this tool are not direct recommendations to buy or sell. They are technical observations for your own analysis and consideration.

Session Breakout, Retest, Reversal + Large Move Alert# Script Description for Publication
## Script Name
**Session Breakout, Retest, Reversal + Large Move Alert**
## Short Description
A professional trading indicator that identifies session breakouts, failed retests, and large intraday price movements across any futures contract with real-time alerts and visual markers.
## Long Description
This comprehensive indicator combines session analysis with dynamic move detection, designed for active traders monitoring ES, NQ, GC, CL, and other futures contracts.
**Core Features:**
**Session Tracking:**
Automatically identifies and marks daily session breakouts and failed retests based on user-defined session times and timezones. The indicator draws visual boxes showing session highs (PH) and lows (PL), with labels marking breakout (BO) and retest failure (RF) points.
**Dynamic Large Move Detection:**
Monitors candles on any chart interval for significant price movements. The threshold is fully customizable per futures contract (default 15 points for ES/NQ/GC). When a candle closes with a move exceeding the threshold, the indicator displays a "BO" label with the exact move size and current chart timeframe.
**Real-Time Alerts:**
Triggers active alerts whenever large moves are detected, allowing traders to receive instant notifications via TradingView's alert system for timely entry or exit opportunities.
**Multi-Timeframe Compatible:**
Works seamlessly on any chart interval (1-minute through daily and beyond) without manual adjustments. The detection threshold automatically applies to the current chart's candles, with labels displaying the active timeframe.
**Universal Futures Support:**
Configurable for any futures contract by adjusting the point threshold input parameter based on each contract's typical volatility.
## Key Inputs
| Input | Default | Purpose |
|-------|---------|---------|
| Session Time | 0400-0930 | Defines trading session hours (pre-market session) |
| Session Timezone | America/New_York | Sets timezone for session detection |
| Point Move Threshold | 15.0 | Minimum point move to trigger alert (adjust per futures: ES=15, GC=15, CL=1.5) |
## How to Use
1. **Add to Chart:** Search for this indicator in TradingView and add it to your futures chart (ES, NQ, GC, CL, etc.)
2. **Configure Inputs:**
- Set session start/end times for your preferred trading session
- Adjust point threshold based on your futures contract
- Verify timezone matches your trading location
3. **Create Alerts:**
- Click "Create Alert" on the chart
- Select "Large Move Alert" from the condition dropdown
- Choose notification method (push, email, or SMS)
- Set desired frequency
4. **Monitor Moves:**
- Watch for "BO" labels appearing on confirmed candles
- Each label shows the threshold value and actual move size
- Combine with your existing trading strategy for confirmation
## Visual Elements
- **Session Box:** Blue shaded area showing session high/low range
- **PH Label:** Green label marking session high (pivot high)
- **PL Label:** Red label marking session low (pivot low)
- **BO ↑/↓ Labels:** Lime/red labels marking session breakouts
- **RF Labels:** Yellow/orange labels marking failed retests
- **Large Move Labels:** Green (bullish) or red (bearish) labels showing threshold breaches with move size
## Ideal For
- Scalpers monitoring quick intraday moves
- Day traders tracking pre-market breakouts
- Futures traders on ES, NQ, GC, CL, and other contracts
- Multi-timeframe traders watching various chart intervals simultaneously
- Alert-based automated trading systems
## Technical Details
- **Pine Script Version:** 5
- **Overlay:** Yes (displays on price chart)
- **Historical Buffer:** 5000 bars (supports 1-minute and lower timeframes)
- **Compatibility:** All futures contracts and chart intervals
## Disclaimer
This indicator is provided for educational and informational purposes only. It is not financial advice. Users should conduct their own research and consult with financial professionals before making trading decisions. Past performance does not guarantee future results.
---

SZO - Signal Zone Oscillator ## Signal Zone Oscillator - SZO
**Created by:** @TraderCurses
**Version:** 1.0 (October 2025)
### ▌ OVERVIEW
The Signal Zone Oscillator (SZO) is a comprehensive momentum tool designed to provide a clearer, more nuanced view of market dynamics. It synthesizes three of the most powerful classic indicators—RSI, a unique MACD Ratio, and the Stochastic oscillator—into a single, unified signal.
The indicator's core feature is the **"Signal Zone"**: a colored area between the main oscillator line and its moving average filter. This zone makes it incredibly easy to visualize shifts in momentum, trends, and potential entry/exit points.
### ▌ KEY FEATURES
* **Composite Formula:** Combines RSI, MACD Ratio, and Stochastic using a weighted average to measure underlying market momentum.
* **The Signal Zone:** The flagship feature. The area between the SZO line and its filter is colored **green** in a bullish context (SZO above filter) and **red** in a bearish context (SZO below filter).
* **Dynamic Coloring:** Both the main SZO line and its filter change color dynamically, providing instant feedback on direction and strength.
* **Zero-Line Reference:** A dashed zero line acts as a classic equilibrium level, helping to confirm stronger bullish or bearish momentum.
* **Fully Customizable:** Every parameter is adjustable. You can change the lengths, sources, and even the weights of the core indicators from the settings menu.
* **Built-in Alerts:** Comes with pre-configured alerts for crossovers of the filter and the zero line, allowing you to automate your monitoring.
### ▌ HOW TO USE IT
The SZO provides several clear signals for traders:
1. **Bullish Signal:**
* The SZO line crosses **above** its filter.
* The Signal Zone turns **green**.
* A cross above the zero line can be used as further confirmation of strong bullish momentum.
2. **Bearish Signal:**
* The SZO line crosses **below** its filter.
* The Signal Zone turns **red**.
* A cross below the zero line can be used as further confirmation of strong bearish momentum.
3. **Divergences:**
* Like any oscillator, look for divergences between the SZO's peaks/troughs and the price action to spot potential reversals.
This tool is designed for traders who want to cut through the noise and get a clear, actionable signal from multiple momentum sources at once. Happy trading!

Rebound Sigma Pro - IndicatorOverview
Rebound Sigma Pro is a mean-reversion indicator that detects statistically oversold conditions in trending markets.
It helps traders identify potential short-term rebounds based on momentum exhaustion and volatility-adjusted entry zones.
Concept
The indicator combines two quantitative components:
Short-term momentum to detect short-term exhaustion
Trend filter to ensure setups align with the long-term direction
When a stock in an uptrend becomes temporarily oversold, a limit-entry signal is plotted.
The trade is then tracked until short-term conditions normalize or a time-based exit occurs.
Visual Signals
Green Triangle: Suggests placing a limit order for the next session
Green Circle: Confirms entry was filled
Red Triangle: Signals an exit for the next session’s open
Orange Background: Pending order
Green Background: Position active
Red Background: Exit phase
Yellow Line: Entry reference price
User Inputs
Limit Entry (% below previous close) – Default 1 %
Use Limit Entry – Switch between limit or market entries
Enable Time Exit – Optional holding-period constraint
Maximum Holding Days
All other internal parameters (momentum length, filters) are pre-configured.
Alerts
Limit Order Signal: New setup detected
Entry Confirmed: Order filled
Exit Signal: Exit expected next day
Usage
Designed for liquid equities and ETFs
Works best in confirmed uptrends
Backtesting encouraged to adapt parameters per symbol and timeframe
Notes
Not an automated strategy; manual order execution required
Past behavior does not imply future performance
Always apply sound position sizing and risk management
Disclaimer
This indicator is provided for educational and analytical purposes only.
It does not constitute financial advice or performance assurance.

Stochastic Arrows Crossover with Alerts [TED]This indicator highlights key Stochastic %K and %D crossovers, helping traders identify potential buy and sell signals with visual triangle arrows and custom alerts. It uses the Stochastic Oscillator, which is a momentum indicator that compares the closing price to the price range over a given period.
Key Features:
Visual Arrows: The indicator plots green triangle-up arrows for bullish crossovers and red triangle-down arrows for bearish crossovers on the chart.
Customizable Parameters: You can adjust the period for %K, %D, and the smoothing factor to fit your trading strategy.
Overbought/Oversold Zones: The background color fills between the 80 (Overbought) and 20 (Oversold) levels, helping you visualize potential reversal areas.
Alerts: Set up dynamic alerts based on the crossover events, including:
Bullish and Bearish Crossovers
Crossover Events from the Previous Bar
How to Use:
Bullish Signal: When the %K line crosses above the %D line, it signals a potential buying opportunity. This is visually represented with a green triangle-up arrow on the chart.
Bearish Signal: When the %K line crosses below the %D line, it signals a potential selling opportunity, indicated by a red triangle-down arrow on the chart.
Overbought/Oversold Zones: The background color fill helps identify overbought or oversold market conditions, which may indicate a potential reversal.
Custom Alerts:
You can set alerts for:
Bullish Crossover: When the %K line crosses above the %D line.
Bearish Crossover: When the %K line crosses below the %D line.
Previous Bar Crossovers: Alerts for crossovers from one bar ago (helpful for backtesting).
Instructions:
Add the Indicator: Apply this Stochastic Arrows Crossover indicator to your chart from the public library.
Customize Settings: Adjust the input parameters like K period, D period, and Smoothing to match your preferred settings.
Enable Alerts:
Once added to your chart, you can set up alerts from the Alert Panel on TradingView.
Choose from the available alert conditions (Bullish Crossover, Bearish Crossover, or Crossover from the Previous Bar).
Set your desired timeframe and alert message to receive notifications for the crossovers.
Monitor the Chart: Keep an eye on the arrows and background color fill to interpret potential trade setups based on the Stochastic Oscillator's behavior.
Zay Gwet AlertEMA 9, VWAP and ORB 15 minutes alert in Burmese. When the market across the EMA 9 will give alert to buy or sell. And when the market across the VWAP and ORB 15 will alert as well. Especially for Burmese community as it is in Burmese language.

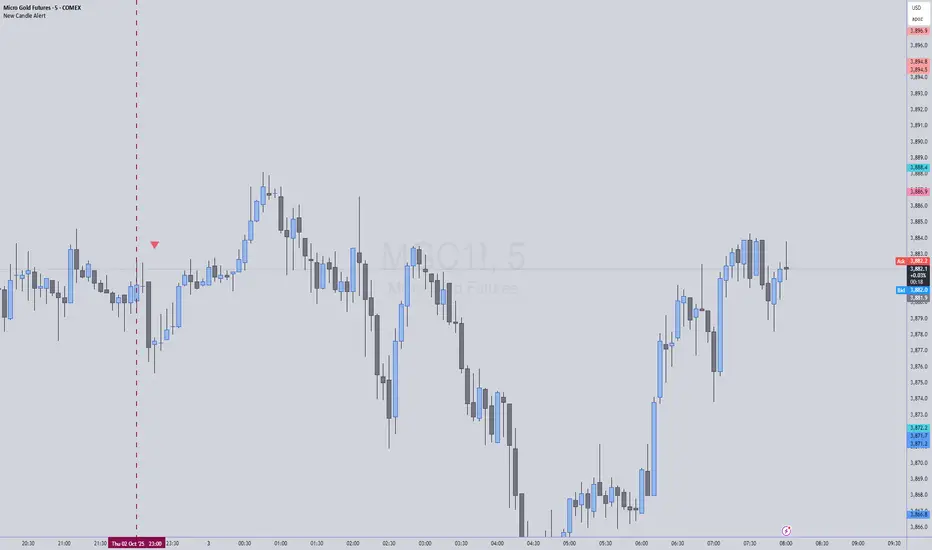
New Candle Alert with Time WindowJust needed a way to specify a time window on a timeframe and get alerts for each new candle
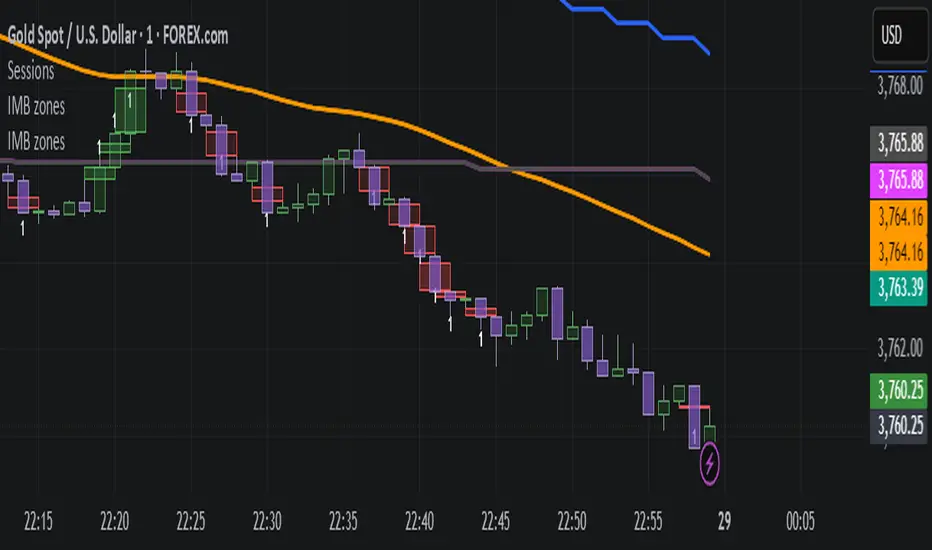
IMB zones, alerts, 8 EMAs, DO lvlThis indicator was created to be a combined indicator for those who use DO levels, IMBs, and EMAs in their daily trading, helping them by providing a script that allows them to customize these indicators to their liking.
Here you can set the IMBs, DO levels, and EMAs. Its special feature is that it uses alerts to indicate which IMB zones have been created, along with the invalidation line for the new potential IMB.
The program always calculates the Daily Opening (DO) level from the opening of the broker, and you can set how many hours the line should be drawn.
Help for use:
There are 3 types of alerts:
- Use the "Bullish IMB formed" alert if you are looking for Bull IMBs.
- Use the "Bearish IMB formed" alert if you are looking for Bear IMBs.
- Use the "Either IMB" alert if you are looking for Bull and Bear IMBs.
Tip: Set the alert type "Once per bar close" if you do not want to set new alerts after an IMB is formed.
IMBs:
- Customizable IMB quantity (1-500 pcs)
- Zone colors and borders can be customized
- Potential IMB line can be customized
EMAs:
- You can set and customize 8 EMA lengths
- Only the current and higher timeframe EMAs are displayed
Daily Open Level:
- Displays today's Daily Open level
- Note: The DO level does not work in Replay mode
Last OFR:
"Show True OFR" checkbox added.
It displays the latest OFR, and hides the old ones.
Trey London + NY Open AlertsThis is a indicator that alerts you when London & New York opens everyday of the week.
Instructions are included if any confusion:
- Adjust Timezones:
UTC Offset
Change this if your broker’s chart is in a different timezone.
Example: 2 for UTC+2 (default).
- Enable / Disable Alerts:
Visual Alerts (Labels)
Toggle On/Off to show labels above/below candles.
Sound Alerts
Toggle On/Off to play an alert sound when a session starts
- Using Alerts:
Go to TradingView Alerts (⏰).
Create a new alert and select:
Condition: London Open or New York Open
Action: Show pop-up, play sound, or send notification.
Alerts will trigger exactly at the session start.
Expiration: set the date as far back as you can and the time to around 23:00. You will have renew the alert after Expiration or update it to a later time.
(These things may be upgraded in the future if subscription is upgraded.)

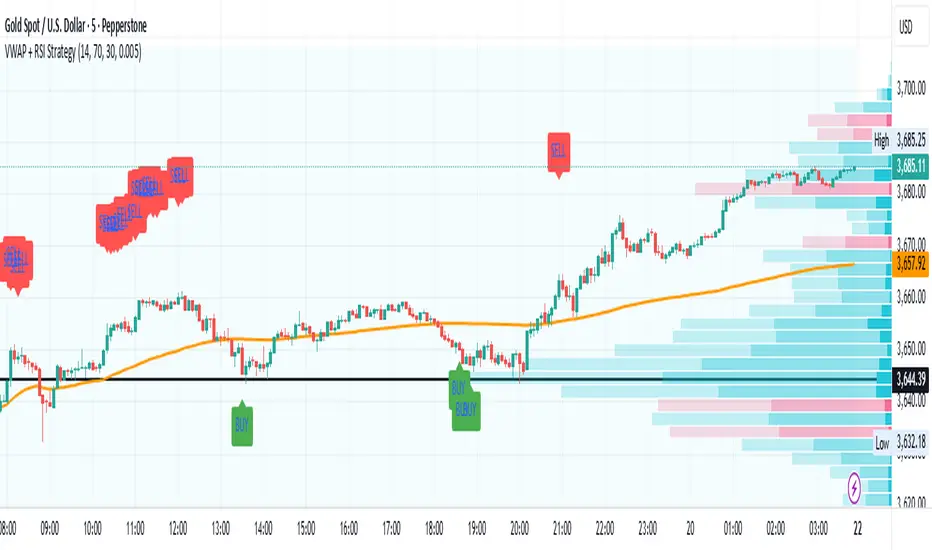
VWAP + RSI Strategytesting this method, based on RSI combine with Vwap
there is a buy and sell alert, if you like pls comment it, this is a simple method that can surely adapt to any assets,
Outside the Bollinger Bands Alerting Indicator Overview
The Outside the Bollinger Bands Alerting Indicator is a comprehensive technical analysis tool that combines multiple proven
indicators into a single, powerful system designed to identify high-probability reversal patterns at Bollinger Band extremes. This
indicator goes beyond simple band touches to detect sophisticated pattern formations that often signal strong directional moves.
Key Features & Capabilities
🎯 Advanced Pattern Recognition
Bollinger Band Breakout Patterns
- Detects "pierce-and-reject" formations where price breaks through a Bollinger Band but immediately reverses back inside
- Identifies failed breakouts that often lead to strong moves in the opposite direction
- Combines multiple confirmation signals: engulfing candle patterns, MACD momentum, and ATR volatility filters
- Visual alerts with symbols positioned below (bullish) or above (bearish) candles
Tweezer Top & Bottom Patterns
- Identifies consecutive candles with nearly identical highs (tweezer tops) or lows (tweezer bottoms)
- Requires at least one candle to breach the respective Bollinger Band
- Confirms reversal with directional close requirements
- Customizable tolerance settings for pattern sensitivity
- Visual alerts with ❙❙ symbols for easy identification
📊 Multi-Indicator Integration
Bollinger Bands Indicator
- Dual-band configuration with outer (2.0 std dev) and inner (1.5 std dev) bands that can be adjusted to suit your own parameters
- Configurable MA types: SMA, EMA, SMMA (RMA), WMA, VWMA
- Customizable length, source, and offset parameters
- Color-coded band fills for visual clarity
Moving Average Suite
- EMA 9, 21, 50, and 200 (individually toggleable)
- Special "SMA 3 High" for help visualizing and detecting Bollinger Band break-outs
- Dynamic color coding based on price relationship
Optional Ichimoku Cloud overlay
- Complete Ichimoku implementation with customizable periods
- Dynamic cloud coloring based on trend direction
- Toggleable overlay that doesn't interfere with other indicators
🚨 Comprehensive Alert System
Real-Time JSON Alerts
- Sends structured data on every confirmed bar close
- Includes all indicator values: BB levels, EMAs, MACD, RSI
- Contains signal states and crossover conditions
- Perfect for automated trading systems and webhooks
{"timestamp":1753118700000,"symbol":"ETHUSD","timeframe":"5","price":3773.3,"bollinger_bands":{"upper":3826.95,"basis":3788.32,"lower":3749.68},"emas":{"ema_9":3780.45,"ema_21":3788.92,"ema_50":3800.79,"ema_200":3787.74,"sma_3_high":3789.45},"macd":{"macd":-10.1932,"signal":-11.3266,"histogram":1.1334},"rsi":{"rsi":40.5,"rsi_ma":39.32,"level":"neutral"}}
Specific Alert Conditions
- MACD histogram state changes (rising to falling, falling to rising)
- RSI overbought/oversold crossovers
- All pattern detections (BB Bounce, Tweezer patterns)
- Bollinger Band breakout alerts
🎨 Visual Elements
Pattern Identification
- ♻ symbols for Bollinger Band breakout patterns (green for bullish, red for bearish)
- ❙❙ symbols for tweezer patterns (green below for bottoms, red above for tops)
- Color-coded band fills for trend visualization
Chart Overlay Options
- All moving averages with distinct colors
- Bollinger Bands with inner and outer boundaries
- Optional Ichimoku cloud with trend-based coloring
Trading Applications
Reversal Trading
- Identify high-probability reversal points at extreme price levels
- Use failed breakout patterns for entry signals
- Combine multiple timeframes for enhanced accuracy
Trend Analysis
- Monitor moving average relationships for trend direction
- Use Ichimoku cloud for trend strength assessment
- Track momentum with MACD and RSI integration
Risk Management
- ATR-based volatility filtering reduces false signals
- Multiple confirmation requirements improve signal quality
- Real-time alerts enable prompt decision making
Suggested Use
- Use on multiple timeframes for confluence
- Combine with support/resistance levels for enhanced accuracy
- Set up alerts for hands-free monitoring
- Customize settings based on market volatility and trading style
- Consider volume confirmation for stronger signals

Alert N seconds before candle closeThe indicator alerts about the closing of the candle in N seconds.
Instruction:
1. Add an indicator
2. Specify the time in the indicator settings
3. Alt+A, Condition - choose indicator
