Auto AI Trendlines [TradingFinder] Clustering & Filtering Trends🔵 Introduction
Auto AI trendlines Clustering & Filtering Trends Indicator, draws a variety of trendlines. This auto plotting trendline indicator plots precise trendlines and regression lines, capturing trend dynamics.
Trendline trading is the strongest strategy in the financial market.
Regression lines, unlike trendlines, use statistical fitting to smooth price data, revealing trend slopes. Trendlines connect confirmed pivots, ensuring structural accuracy. Regression lines adapt dynamically.
The indicator’s ascending trendlines mark bullish pivots, while descending ones signal bearish trends. Regression lines extend in steps, reflecting momentum shifts. As the trend is your friend, this tool aligns traders with market flow.
Pivot-based trendlines remain fixed once confirmed, offering reliable support and resistance zones. Regression lines, adjusting to price changes, highlight short-term trend paths. Both are vital for traders across asset classes.
🔵 How to Use
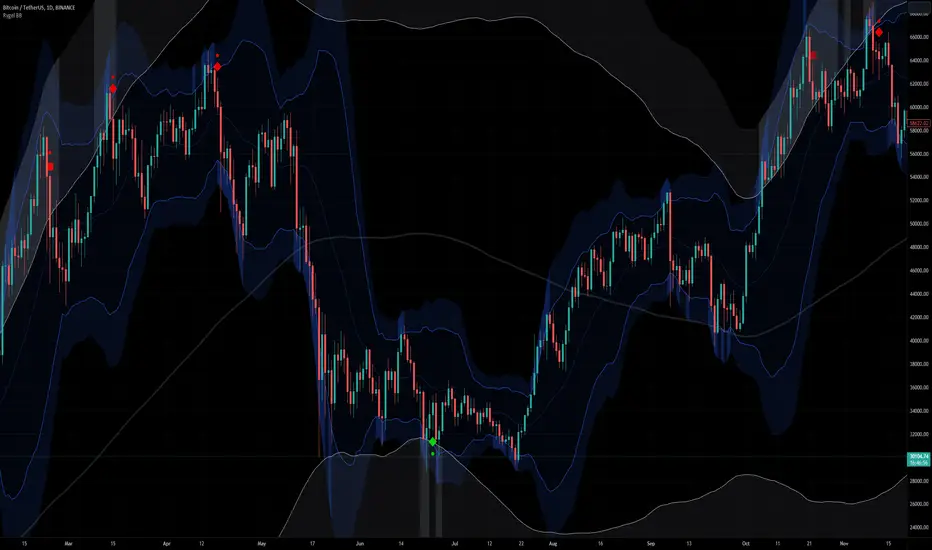
There are four line types that are seen in the image below; Precise uptrend (green) and downtrend (red) lines connect exact price extremes, while Pivot-based uptrend and downtrend lines use significant swing points, both remaining static once formed.
🟣 Precise Trendlines
Trendlines only form after pivot points are confirmed, ensuring reliability. This reduces false signals in choppy markets. Regression lines complement with real-time updates.
The indicator always draws two precise trendlines on confirmed pivot points, one ascending and one descending. These are colored distinctly to mark bullish and bearish trends. They remain fixed, serving as structural anchors.
🟣 Dynamic Regression Lines
Regression lines, adjusting dynamically with price, reflect the latest trend slope for real-time analysis. Use these to identify trend direction and potential reversals.
Regression lines, updated dynamically, reflect real-time price trends and extend in steps. Ascending lines are green, descending ones orange, with shades differing from trendlines. This aids visual distinction.
🟣 Bearish Chart
A Bullish State emerges when uptrend lines outweigh or match downtrend lines, with recent upward momentum signaling a potential rise. Check the trend count in the state table to confirm, using it to plan long positions.
🟣 Bullish Chart
A Bearish State is indicated when downtrend lines dominate or equal uptrend lines, with recent downward moves suggesting a potential drop. Review the state table’s trend count to verify, guiding short position entries. The indicator reflects this shift for strategic planning.
🟣 Alarm
Set alerts for state changes to stay informed of Bullish or Bearish shifts without constant monitoring. For example, a transition to Bullish State may signal a buying opportunity. Toggle alerts On or Off in the settings.
🟣 Market Status
A table summarizes the chart’s status, showing counts of ascending and descending lines. This real-time overview simplifies trend monitoring. Check it to assess market bias instantly.
Monitor the table to track line counts and trend dominance.
A higher count of ascending lines suggests bullish bias. This helps traders align with the prevailing trend.
🔵 Settings
Number of Trendlines : Sets total lines (max 10, min 3), balancing chart clarity and trend coverage.
Max Look Back : Defines historical bars (min 50) for pivot detection, ensuring robust trendlines.
Pivot Range : Sets pivot sensitivity (min 2), adjusting trendline precision to market volatility.
Show Table Checkbox : Toggles display of a table showing ascending/descending line counts.
Alarm : Enable or Disable the alert.
🔵 Conclusion
The multi slopes indicator, blending pivot-based trendlines and dynamic regression lines, maps market trends with precision. Its dual approach captures both structural and short-term momentum.
Customizable settings, like trendline count and pivot range, adapt to diverse trading styles. The real-time table simplifies trend monitoring, enhancing efficiency. It suits forex, stocks, and crypto markets.
While trendlines anchor long-term trends, regression lines track intraday shifts, offering versatility. Contextual analysis, like price action, boosts signal reliability. This indicator empowers data-driven trading decisions.
Alert

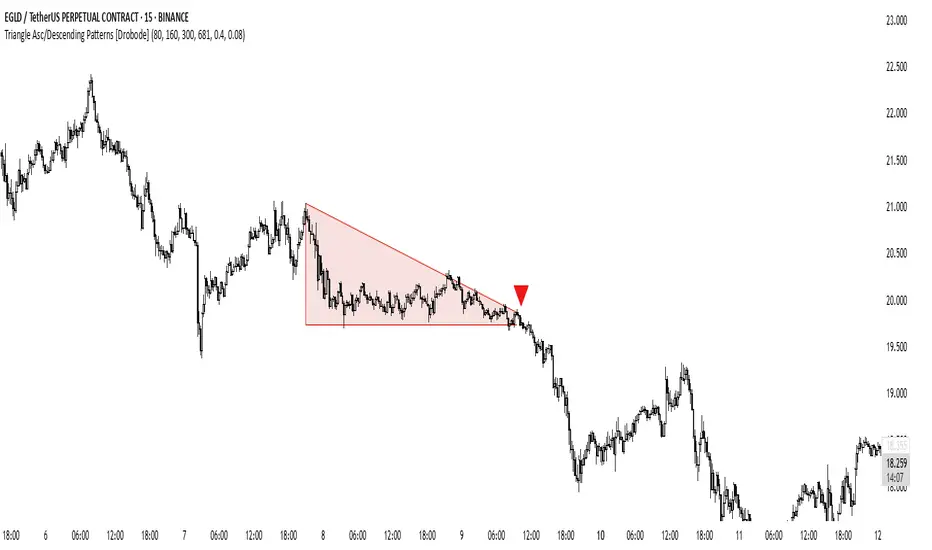
Triangle Asc/Descending Patterns [Drobode]█ DESCRIPTION
The script automatically tracks the descending or ascending triangle pattern. The script provides advanced settings, allowing you to adjust the pattern accuracy from high to low depending on your needs and technical analysis style. The main goal of the script is to facilitate the routine work of a trader in identifying certain trading situations (patterns). However, you should understand that the script is not a full-fledged self-sufficient strategy, in case of receiving a signal, it is recommended that you additionally conduct a comprehensive thorough analysis before taking trading actions. The script can be useful for traders of all levels, both beginners and experienced analysts. This variation of the script, in case of identifying a pattern, draws a contour triangle with the background color of the figure. The ascending triangle has a blue color, the descending triangle has a red color. The logic of the script provides that one of the legs (one side) of the triangle is always a horizontal line, simultaneously being a line of resistance or support, other variations of triangle patterns are not tracked. According to generally defined beliefs and observations of pattern formation, a descending and ascending triangle may indicate a possible breakdown of the conditional horizontal level to which the price of the instrument has approached, however, at the same time it is necessary to deeply analyze many other factors at this point, in particular, such as volumes, consolidation, volatility, and so on.
█ SCRIPT SETTINGS
By default, the script was pre-developed and tested on the M15 timeframe with the USDT.P crypto futures instruments.
Alert
The Alert function in the script is enabled by default, you just need to activate the Alert in the TradingView window and select the signal source - Triangle Asc/Descending Patterns .
The notification provides the following information (example):
Triangle_Ascending
Ticker- EGLDUSDT.P
Price-19.754
Timeframe- 15
Period length-160
Periods length
The script allows you to set the period length (number) of bars on which the calculation will be performed. Different periods make it possible to cover more timeframes (in particular, larger timeframes). The calculation is performed simultaneously on all periods, but you can turn off "Period length 3" and "Period length 4" by clicking on the check mark, this can speed up the script. The following period values are set by default: "Period length 1" – 80,
"Period length 2" – 160, "Period length 3" – 300, "Period length 4" – 681.
Percentage deviation of extremes
The next settings are the percentage deviation from the hypotenuse and horizontal leg, which creates the zone in which the extremes of the bars that will form the triangle shape should be. The smaller the deviation, the greater the accuracy and the closer to the hypotenuse and leg the bar extrema should be, however, in this case the number of pattern identifications will be smaller. By default, the deviation zone from the hypotenuse "Deflection zone of tangents to the hypotenuse" is - 0.4%, the deviation zone from the horizontal leg "Tangent deviation zone horizontal leg" is - 0.08%.
The presence of extrema at certain points on the sides of a triangle
The last block of settings are the conditions that increase the accuracy of the proportions of the pattern figure. These settings are aimed at confirming the presence of extrema in certain areas along the hypotenuse and horizontal leg. Thus, enabling "Extrema on the horizontal leg almost along the entire length" means that only those triangles will be tracked in which the horizontal leg zone has extrema almost along the entire length of this leg, this increases the accuracy but reduces the number of detected patterns. "Extremes present on second half of horizontal leg (more than 50%)" assumes that only those triangles will be tracked in which the extrema are present on the second half of the length of the given leg (more than 50%) in the zone of the horizontal leg. "Presence of an extrema in the middle region of the hypotenuse" assumes that only those triangles will be tracked in which the extrema are present on a certain segment of length in the central region of the hypotenuse.
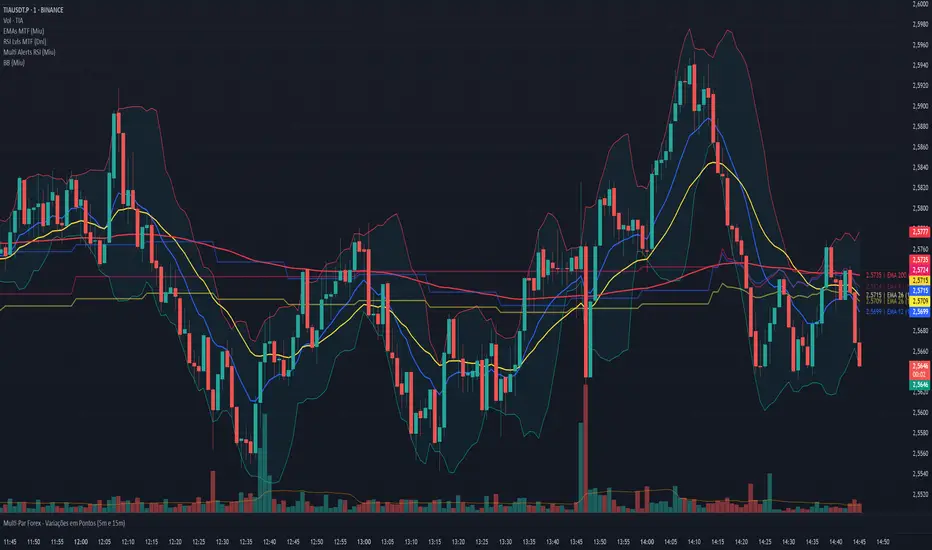
Bollinger Bands - Multi Symbol Alert (Miu)This script extends the classic Bollinger Bands indicator with support for up to 8 user-defined symbols and a unique alert system.
Unlike traditional Bollinger Band indicators, it allows traders to configure alerts across multiple assets without keeping the indicator visible on the chart, making it ideal for passive multi-asset monitoring.
What it does:
This script calculates Bollinger Bands using a 100-period simple moving average and a standard deviation multiplier of 3 (or any input you set in the settings panel).
For each selected symbol, the upper and lower bands are retrieved using request.security() and monitored for breakouts.
Alerts are triggered when the closing price of the selected symbol breaks above the upper band (Overbought) or below the lower band (Oversold) — at the bar close.
How to use it:
1) Add the indicator to your chart.
2) Open the settings panel.
3) Select up to 8 symbols to monitor.
4) After setting parameters, click the three dots next to the indicator title and choose "Add Alert on...".
5) Name your alert and confirm.
6) If you don’t wish to keep the indicator visible, you can remove it from the chart — alerts will still function as expected.
Alert message includes:
- Symbol name (e.g., BTC, ETH, LTC)
- (OB) for overbought or (OS) for oversold
- Symbol’s price at the alert moment
Technical note:
This script uses request.security() to fetch Bollinger Band levels and closing prices from up to 8 selected symbols in real time.
Feel free to leave your feedback or suggestions in the comments section below.
Enjoy!
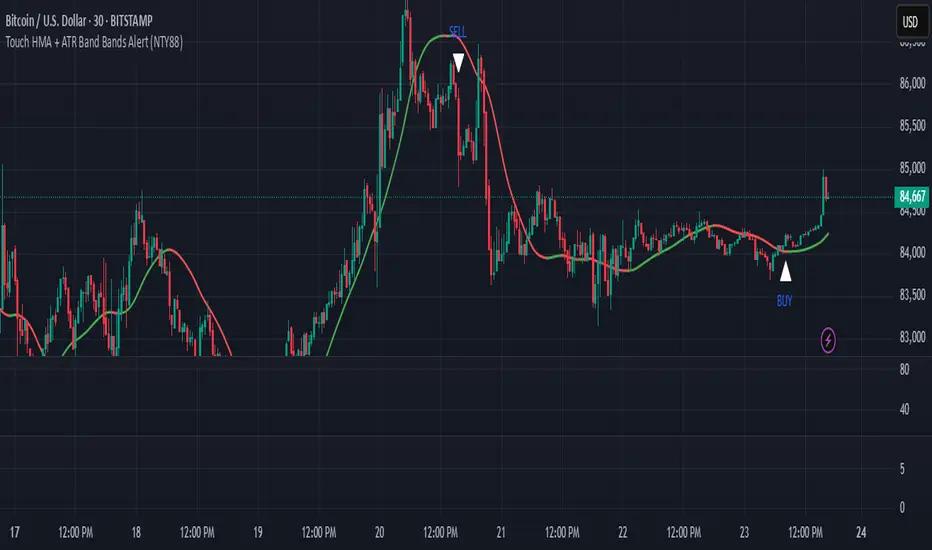
Touch HMA + ATR Band Bands Alert (NTY88)🔔 Precision Alerts | No Repainting | ATR-Based Touch Detection | HMA Trend Coloring
This script is a clean and powerful tool designed to help you catch precise market reversals using ATR Band touches combined with trend-following logic.
📌 How It Works
A custom Hull Moving Average (HMA) is used to track the trend.
Two dynamic ATR-based bands are drawn above and below the HMA.
A signal is generated when the closing price touches the upper or lower ATR band within a small tolerance zone.
✅ Key Features
🔁 Alternating Signals: Only one Buy → then one Sell → then Buy again. No signal spam.
🟢🔴 Color-Changing HMA Line: Green = HMA rising | Red = HMA falling
📏 Price Tolerance Input: Define how close the candle must be to the ATR band to trigger a signal.
🔔 Real-Time Alerts: Easily set alerts for Buy and Sell signals — works in live markets.
🚫 No Repainting: All signals are confirmed at candle close and will not change afterward.
🎯 When to Use
Great for trend reversals, scalping zones, or identifying potential exhaustion points.
Works well on any timeframe or market (crypto, stocks, forex).
💬 Pro Tip:
Combine this with RSI, Volume, or ADX filters to build a complete confluence system.
📈 Built for traders who love clean logic, precision entries, and visual clarity.
JJ/CG - Dynamic Mean Reversion Indicator with Candle Size FilterDynamic Mean Reversion Indicator (DMR 250 EMA)
📌 Best Timeframes: 5m / 15m / 1hr
📊 Works on All Markets: Crypto, Forex, Stocks, Commodities
How It Works (Based on Script)
This indicator is built around the 250 EMA (Exponential Moving Average) and tracks price movements in relation to it. It identifies extreme price deviations and detects when price has moved too far from the EMA, signaling potential reversion points.
🔹 Core Components:
250 EMA as a Baseline
The script calculates a 250-period EMA, which acts as a dynamic trend guide.
Price Deviation Calculation
The script measures the absolute difference between price and the 250 EMA.
It tracks the highest deviation over a set lookback period (default: 1000 candles).
A dynamic threshold is created based on the highest historical deviation, multiplied by a user-defined factor (default: 0.85).
Candle Size Filter
The script calculates the average candle size over a lookback period (default: 50 candles).
If a candle is significantly larger than the average (based on a multiplier, default: 2.0x), it is flagged as an important move.
Long & Short Signal Conditions
Long Signal (Buy Signal):
Price is significantly below the EMA (beyond the dynamic threshold).
A large candle is present.
Short Signal (Sell Signal):
Price is significantly above the EMA (beyond the dynamic threshold).
A large candle is present.
Alerts & Visuals
When conditions are met, the script plots "Buy" signals below the price and "Sell" signals above the price.
Users can set up alerts to get notified when a signal occurs.
How to Use It
Price tends to revert to the 250 EMA after extreme deviations.
Use this indicator with support/resistance levels, RSI, and Stochastic for confirmation.
Best used in volatile markets where price moves sharply away from the mean.
⚠ Not a standalone indicator – combine with other tools for better accuracy! 🚀ator – use it with RSI, Stochastic, and solid TA for best results! 🚀
ZenAlgo - BenderThis script combines several volume-based methodologies into a single chart overlay to help traders analyze market participation and volume distribution. It aggregates volume from multiple sources—spot and perpetual markets across different exchanges—and processes it to display various insights directly on the chart.
The script provides a detailed view of both individual-bar volume and broader aggregated trends. It calculates certain values, plots different shapes and overlays, and includes an optional informational table. However, it does not offer financial signals or predict future price movements. Instead, it presents multiple volume and range-related highlights for educational or analytical observations.
Below is a detailed breakdown of the core elements in this script:
Core Data Calculation and Aggregation
To build a comprehensive volume picture, the script retrieves volume data from multiple predefined exchanges for both Spot and Perpetual pairs. The volume for each bar is processed in Aggregated mode , meaning it combines data across selected sources to produce a single composite volume value.
The script applies average-based aggregation to calculate the final volume figures. The total volume is then used as the basis for further calculations, such as buy/sell volume decomposition and Delta analysis.
Buy/Sell Volume Decomposition
Each bar’s total volume is separated into an estimated buy portion and a sell portion. This decomposition uses logic that considers wick length, body size, and whether the bar closed higher or lower than it opened. The script assigns fractions of the total volume to the upper wick, lower wick, and body, then multiplies these by the total aggregated volume to estimate buy and sell volumes.
This breakdown is calculated separately for spot-only volume , perp-only volume , and their aggregated sums, allowing traders to analyze how much of each bar’s volume is estimated as "buy" or "sell."
Delta and Cumulative Delta
The script computes a Delta (buy volume minus sell volume) for each bar. A positive Delta suggests more buying during that bar, while a negative Delta suggests more selling.
It also computes Cumulative Delta , summing this Delta over 14 bars (a fixed period). This allows users to observe how short-term buy/sell imbalances accumulate over time.
Visual Bar Coloring (PVSRA Logic)
The script includes logic based on PVSRA (Price Volume Support Resistance Analysis) , which examines average volume over a recent lookback period to determine whether a bar meets certain "climax" or "above-average" thresholds.
Bars are categorized as:
Climax Up or Climax Down: If a bar meets strong volume and range conditions, it is identified as a high-activity bar.
Neutral Colors: Bars that do not meet the threshold are identified as standard volume bars.
Table Summaries
The script includes an optional Spot vs. Perpetual volume table that provides:
Aggregated Spot vs. Perpetual buy/sell volumes
The net difference between buying and selling
The total sum across all included sources
Percentage breakdown of buying vs. selling
A separate multi-timeframe table calculates volume-related metrics for fixed timeframes (15, 60, and 240 minutes), allowing traders to compare their current timeframe with broader trends.
Highlighted Shapes and Diamonds
The script places shape markers above or below bars when certain conditions are met, including:
Dots (circles): Representing a significant increase in net Delta compared to the previous bar.
Diamonds: Markers that appear when volume-based conditions align with predefined thresholds. These vary in size and include an optional "Hardcore Mode" , which applies stricter filtering.
Crossover Triangles: These appear when the internally computed Delta MA (a moving average of Delta) crosses above or below a predefined EMA.
These markers highlight notable changes in volume, Delta, or price action but do not constitute predictive trading signals.
Delta Averages and Overlaid EMAs
The script plots a histogram of the current net Delta (buy minus sell) . Additionally, a Delta Moving Average (Delta MA) is used for tracking trends. The Delta MA is plotted alongside predefined Exponential Moving Averages (EMAs) , such as:
A Delta MA calculated using an exponential moving average (EMA) over 21 bars.
A set of predefined EMAs (lengths such as 3, 5, 7, 10, 13, 16, 21, 25, etc.) plotted to visualize momentum changes.
Areas between these EMAs can be filled with translucent shading to highlight momentum shifts.
Comparing the Delta MA to the overlaid EMAs helps track changes in Delta momentum over time.
Interpreting the Elements
When using this script, consider the following:
Volume Aggregation: The script aggregates volume across multiple Spot and Perpetual sources to provide a broad market view.
Delta and Cumulative Delta: The Delta histogram may spike positively or negatively, highlighting areas of potential buying or selling pressure.
Table Data: If enabled, the tables display buy/sell volume splits for Spot and Perpetual markets, along with multi-timeframe comparisons.
EMA Overlays on Delta: The stacked EMAs help visualize short-term vs. longer-term Delta changes.
Shape Markers: Dots, diamonds, and triangles emphasize notable shifts in volume or Delta but do not imply recommendations for action.
Usage Tips
Toggle "Hardcore Mode" to apply stricter filtering to highlight conditions.
Enable or disable the Spot vs. Perpetual Table to see if the breakdown of volume sources is useful.
Use the multi-timeframe table to compare intraday data with broader trends.
If the chart appears too cluttered, toggle off features like PVSRA color tints or some EMAs to focus on specific elements.
Final Thoughts
This script integrates multiple volume-based calculations, range analysis, aggregated volume from predefined tickers, and various moving averages for Delta. Its visual layers—color-coded bars, histograms, shape markers, and tables—offer a rich perspective on market activity.
Users can analyze these elements across any timeframe or market combination they prefer. The script does not provide buy/sell signals or make predictions —it is purely an analytical tool for understanding volume-based market dynamics.
Traders should interpret these visual elements according to their own strategy and trading approach.

Cumulative Price Change AlertCumulative Price Change Alert
Version: 1.0
Author: QCodeTrader 🚀
Overview 🔍
The Cumulative Price Change Alert indicator analyzes the percentage change between the current and previous open prices and sums these changes over a user-defined number of bars. It then generates visual buy and sell signals using arrows and labels on the chart, helping traders spot cumulative price momentum and potential trading opportunities.
Key Features ⚙️
Customizable Timeframe 🕒:
Use a custom timeframe or default to the chart's timeframe for price data.
User-Defined Summation 🔢:
Specify the number of bars to sum, allowing you to analyze cumulative price changes.
Custom Buy & Sell Conditions 🔔:
Set individual percentage change thresholds and cumulative sum thresholds to tailor signals for
your strategy.
Visual Alerts 🚀:
Displays green upward arrows for buy signals and red downward arrows for sell signals directly
on the chart.
Informative Labels 📝:
Provides labels with formatted percentage change and cumulative sum details for the analyzed
bars.
Versatile Application 📊:
Suitable for stocks, forex, crypto, commodities, and more.
How It Works ⚡
Price Change Calculation ➗:
The indicator calculates the percentage change between the current bar's open price and the
previous bar's open price.
Cumulative Sum ➕:
It then sums these percentage changes over the last N bars (as specified by the user).
Signal Generation 🚦:
Buy Signal 🟢: When both the individual percentage change and the cumulative sum exceed
their respective buy thresholds, a green arrow and label are displayed.
Sell Signal 🔴: Conversely, if the individual change and cumulative sum fall below the sell
thresholds, a red arrow and label are shown.
How to Use 💡
Add the Indicator ➕:
Apply the indicator to your chart.
Customize Settings ⚙️:
Set a custom timeframe if desired.
Define the number of bars to sum.
Adjust the buy/sell percentage change and cumulative sum thresholds to match your trading
strategy.
Interpret Visual Cues 👀:
Monitor the chart for green or red arrows and corresponding labels that signal potential buy or
sell opportunities based on cumulative price movements.
Settings Explained 🛠️
Custom Timeframe:
Select an alternative timeframe for analysis, or leave empty to use the current chart's timeframe.
Number of Last Bars to Sum:
Determines how many bars are used to compute the cumulative percentage change.
Buy Condition - Min % Change:
The minimum individual percentage change required to consider a buy signal.
Buy Condition - Min Sum of Bars:
The minimum cumulative percentage change over the defined bars needed for a buy signal.
Sell Condition - Max % Change:
The maximum individual percentage change threshold for a sell signal.
Sell Condition - Max Sum of Bars:
The maximum cumulative percentage change over the defined bars for triggering a sell signal.
Best Use Cases 🎯
Momentum Identification 📈:
Quickly spot strong cumulative price movements and momentum shifts.
Entry/Exit Signals 🚪:
Use the visual signals to determine potential entry and exit points in your trading.
Versatile Strategy Application 🔄:
Effective for scalping, swing trading, and longer-term analysis across various markets.
UPD: uncheck labels for better performance

Time-based Alerts for Trading Windows🌟 Time-based Alerts for Trading Windows 🌐📈
This is a re-uploaded script as the previous one got hidden.
This Time-based Alerts for Trading Windows script is a highly customizable and reliable tool designed to assist traders in managing automated strategies or manually monitoring specific market conditions. Inspired by CrossTrade's Time-based Alert, this script is tailored for those who rely on precise time windows to trigger actions, such as sending webhook signals or managing Expert Advisors (EAs).
Whether you are a scalper, day trader, or algorithmic trader, this script empowers you to stay on top of your trades with fully customizable time-based alerts.
🛠️ Customizable Time Alerts
This indicator allows you to create up to 12 unique time windows by specifying the exact hour and minute for each alert. Each time window corresponds to an individual alert condition, making it perfect for managing trades during specific market sessions or key time periods.
For example:
Alert 1 can be set at 9:30 AM (market open).
Alert 2 can be set at 3:55 PM (just before market close).
Each alert can be toggled on or off in the indicator settings, allowing you to manage alerts without having to reconfigure your script.
You can adjust the colours to fit any colour scheme you like!
🕒 Odd and Even Time Alerts
The script comes with three built-in alert type categories:
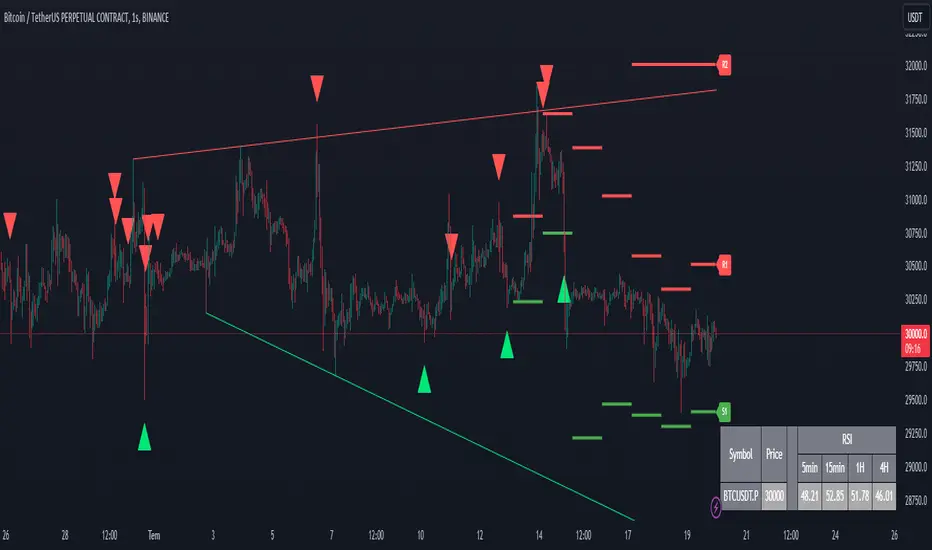
Odd Alerts (marked with a green triangle on the chart): These correspond to odd-numbered inputs like Alert 1, Alert 3, Alert 5, and so on.
Even Alerts (marked with a red triangle on the chart): These correspond to even-numbered inputs like Alert 2, Alert 4, Alert 6, and so on.
You can also customize all 12 alerts individually to include a custom alert message
These alerts serve as a convenient way to differentiate between multiple trading strategies or market conditions. You can customize alert messages for odd and even alerts directly from TradingView’s alert panel.
🔗 Webhook Integration for Automation
This script is fully compatible with webhook-based automation. By configuring your alerts in TradingView, you can send signals to trading bots, EAs, or any third-party system. For example, you can:
Turn off an EA at a specific time (e.g., 3:55 PM EST).
Send buy/sell signals to your bot during predefined trading windows.
Simply use TradingView’s alert message editor to format webhook payloads for your automation system.
🌐 Timezone Flexibility
Trading happens across multiple time zones, and this script accounts for that. You can toggle between:
Eastern Time (New York): Ideal for most US-based markets.
Central Time (Exchange): Useful for futures and commodities traders.
This ensures your alerts are always in sync with your preferred time zone, eliminating confusion.
🎨 Visual Indicators
The script plots visual markers directly on your chart to indicate active alerts:
Up Facing Triangles: Represent odd-numbered alerts, providing a quick reference for these time windows.
Down Facing Triangles: Represent even-numbered alerts, helping you track different strategies or conditions.
These visual markers make it easy to see when alerts are triggered, even at a glance.
📈 Practical Use Case
Let’s say you’re trading the USTEC index on a 1-minute chart. You want to:
Turn off your trading bot at 16:55 EST to avoid after-market volatility.
Trigger a re-entry signal at 17:30 EST to capture moves during the Asian session.
Visually monitor these actions on your chart for easy reference.
This script makes it possible with precision alerts and webhook integration. Simply configure the time windows in the settings and set up your alerts in TradingView.
🚨 How to Set Up Alerts
Enable or Disable Alerts: Use the script’s settings to toggle specific alerts on or off as needed.
Set Custom Time Windows: Define the hour and minute for each alert in the settings panel.
Create Alerts in TradingView:
Go to the TradingView alert panel.
Select the condition (e.g., "Odd Time-based Alert (Green)" or "Even Time-based Alert (Red)").
Customize the alert message for webhook integration or personal notification.
Choose the trigger type: Once Per Bar or Once Per Bar Close to keep the alert active.
Integrate with Webhooks: Use the alert message field to format payloads for automation systems like MT4, MT5, or third-party bots.
📋 Key Notes
Alerts can trigger indefinitely if set to "Once Per Bar" or "Once Per Bar Close".
Always ensure the expiration date is set far in the future to avoid unexpected alert deactivation.
Test webhook messages and alert configurations thoroughly before using them in live trading.
This script is a powerful addition to your trading toolbox, offering precision, flexibility, and automation capabilities. Whether you’re turning off an EA, managing trades during market sessions, or automating strategies via webhooks, this script is here to support you.
Start using the Time-based Alerts for Trading Windows today and trade with confidence! 🚀✨

Momentum candle w/ AlertMomentum Candle Indicator with Alerts
The Momentum Candle Indicator is designed to assist traders in identifying candles that exhibit strong momentum based on customizable criteria. This indicator visually highlights momentum candles and provides alerting functionality to ensure timely notifications about significant price movements. It is flexible and suited for various trading styles, offering easy configuration.
Key Features:
Momentum Candle Detection: Identifies candles with a body size and wick characteristics indicative of momentum. The detection criteria are fully customizable to fit individual trading strategies.
Customizable Parameters:
- Minimum Body Size (Pips): The minimum size of the candle body, in pips, for it to be considered a momentum candle.
- Minimum Wick-to-Body Ratio (%): Specifies the minimum percentage of wick relative to the body size to qualify as momentum.
- Maximum Wick-to-Body Ratio (%): Sets the upper limit for the wick-to-body ratio to filter out candles with excessive wicks.
- Timeframe: Select the timeframe for momentum candle analysis (e.g., 15 minutes, 1 hour, etc.).
- Alert Trigger Option: Choose between alerts that trigger at candle close or in real-time when criteria are met. Real-time alerts are sent as soon as the criteria are met, but there is no guarantee that the candle will remain a valid momentum candle at its close.
- Show Detail: Enable or disable additional labels on the chart that display metrics for valid momentum candles.
- Enable Candle Debug: Activate debug mode to show detailed metrics for every candle, assisting in fine-tuning settings.
Visual Feedback: Highlights valid momentum candles on the chart for easy identification. Optional labels display metrics like body size, wick size, and ratios.
Alerts: Configurable alerts notify you whenever a momentum candle is detected, based on your defined criteria.
How to Use:
Add the Indicator to Your Chart: Add this script to your TradingView chart as an indicator.
Configure the Settings: Open the settings panel and adjust the parameters: Define the Minimum Body Size in pips. Set the Wick-to-Body Ratio thresholds. Choose the timeframe for analysis. Select the alert trigger option ( real-time or candle close ). Enable or disable labels and debug information.
Set Up Alerts: Open the TradingView alert panel. Select the condition for this script (e.g., " Momentum Candle Detected "). Customize the alert message and preferences. Click Create to activate the alert.
Analyze Results: Review highlighted momentum candles on the chart. Use optional debug labels for a detailed breakdown of candle metrics.
Why Use This Indicator?
Momentum candles often indicate significant market movements, providing valuable insights for trend-following or breakout strategies. This indicator automates the detection and alert process, helping traders focus on strategy execution while ensuring they don’t miss key opportunities.
With customizable parameters and real-time feedback, this tool is practical, adaptable, and designed to simplify momentum analysis.

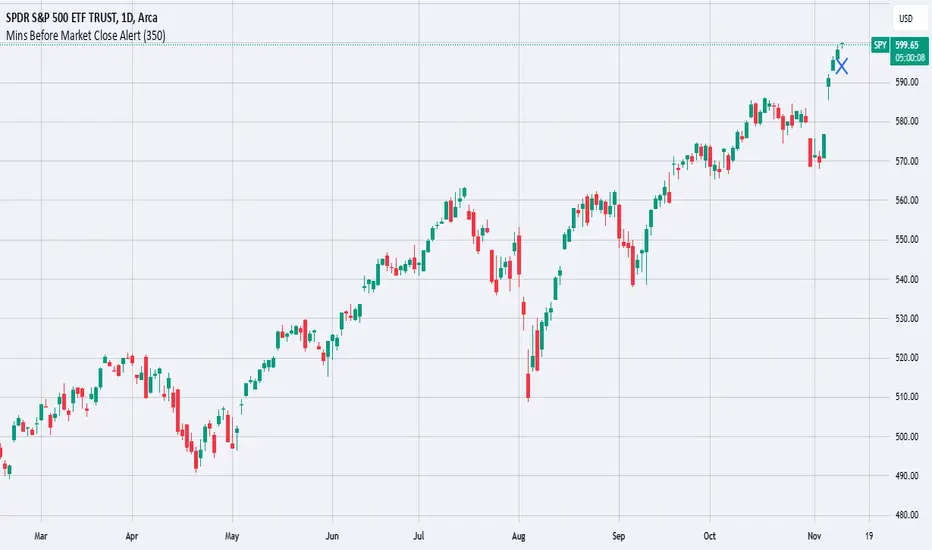
Mins Before Market Close AlertThis script will set an alert X mins before the market closes.
This is meant to be added to daily charts (calculations based off of daily bars).
This script can be useful for sending webhooks before the market closes to close open positions or to open new ones.
Simply add it to your daily chart and set up your desired alert (email, webhook, sound, etc.).
You can also change the chart marker to a different shape, color, or location to your preference.
Enjoy this simple alert!
Standard Deviation-Based Fibonacci Band by zdmre This indicator is designed to better understand market dynamics by focusing on standard deviation and the Fibonacci sequence. This indicator includes the following components to assist investors in analyzing price movements:
Weighted Moving Average (WMA) : The indicator creates a central band by utilizing the weighted moving average of standard deviation. WMA provides a more current and accurate representation by giving greater weight to recent prices. This central band offers insights into the general trend of the market, helping to identify potential buying and selling opportunities.
Fibonacci Bands : The Fibonacci bands located above and below the central band illustrate potential support and resistance levels for prices. These bands enable investors to pinpoint areas where the price may exhibit indecisiveness. When prices move within these bands, it may be challenging for investors to discern the market's preferred direction.
Indecisiveness Representation : When prices fluctuate between the Fibonacci bands, they may reflect a state of indecisiveness. This condition is critical for identifying potential reversal points and trend changes. Investors can evaluate these periods of indecisiveness to develop suitable buying and selling strategies.
This indicator is designed to assist investors in better analyzing market trends and supporting their decision-making processes. The integration of standard deviation and the Fibonacci sequence offers a new perspective on understanding market movements.
#DYOR

Mongoose multi time frame RSI quick glance w/alertsThis Pine Script helps you identify overbought and oversold conditions for any stock, index, or cryptocurrency you're monitoring, across three different time frames (daily, weekly, and monthly). It uses the Relative Strength Index (RSI) as the indicator for these conditions. Here’s a breakdown of what the script does and what it tells you:
Key Features:
RSI Indicator:
The script calculates the RSI for three different timeframes: daily, weekly, and monthly.
RSI is a momentum oscillator that measures the speed and change of price movements, typically on a scale from 0 to 100:
Overbought: RSI > 70 (This could indicate the asset is overvalued and may see a price correction).
Oversold: RSI < 30 (This could indicate the asset is undervalued and may see a price rebound).
Color-Coded Background:
The script visually highlights overbought and oversold conditions by coloring the chart background:
Blue for Daily overbought/oversold.
Green for Weekly overbought/oversold.
Red for Monthly overbought/oversold.
Overbought areas will have the colored background whenever the RSI is above 70.
Oversold areas will have the colored background when the RSI drops below 30.
Multiple Timeframes:
The script checks these overbought and oversold levels on three timeframes (daily, weekly, and monthly) simultaneously, giving you a broad view of the market’s momentum.
This helps you determine whether a price movement is part of a short-term fluctuation (daily), a mid-term trend (weekly), or a long-term cycle (monthly).
Alerts:
If the RSI crosses the overbought or oversold threshold for any of these timeframes, the script will trigger an alert.
The alert message includes the name of the stock or cryptocurrency and the timeframe in which the condition occurred (e.g., "Daily Overbought").
How to Use This Information:
Trading Decisions: You can use this script to help decide when to enter or exit trades based on whether an asset is overbought or oversold in different timeframes.
Buy Signal: When RSI is oversold (below 30) and you expect a price rebound.
Sell Signal: When RSI is overbought (above 70) and you expect a price correction.
Long-Term vs Short-Term: By analyzing the three timeframes, you can tailor your strategy to short-term trades (daily RSI) or longer-term investments (weekly or monthly RSI).
In essence, this script gives you a multi-timeframe RSI-based view of potential reversal points in the market, visually coded for clarity, and alerts you when those levels are hit across different timeframes.
Outlier changes alertAn indicator that calculates click (price change), percentage change, and Z-score changes while displaying outliers based on defined ranges.
Outlier Detection:
Mark outliers (for price, percentage, Z-score) based on user-defined thresholds. For example, any price movement exceeding a certain Z-score or percentage change could be marked as an outlier and displayed on chart.
Indicator Overview:
1. Click (Price Change):
Calculate the absolute price change from one period to another (e.g., from the current closing price to the previous closing price).
2. Percentage Change:
Calculate the percentage price change over a specific period, showing how much the price has changed in relative terms compared to the previous price.
3. Z-Score:
Compute the Z-score to standardize the price change relative to its historical average and standard deviation. The Z-score helps in detecting whether a price movement is an outlier or falls within a normal range of volatility.

v01 remindersTrading requires focus, discipline, and sometimes a reminder to stay on track.
Many of us know how to take trades and make money - but sometimes struggle to hold on to the gains. By knowing not only when to trade, but also when NOT to trade, we can begin to build better habits.
I built this indicator for my own needs, but I hope this indicator can help someone save money by reminding them when to step away, size down or stay on track.
Inspired by trading psychologists like Mark Douglas, David Paul and others, I decided to make an indicator that deals with the mental aspect of trading.
Dr. David Paul said that you can be 10-15 trades away from the trader you want to be. All it takes is 10-15 trades of doing only the right thing (erasing bad habits). After that time the resistance to execute the trades properly will improve even more.
Good trading should be boring and repetitive. If the trading is exciting and varied it is likely unprofitable (more akin to impulsive gambling).
Perhaps you know how to trade, yet keep trading impulsively sometimes, getting "the itch" to trade or gambling with your gains? Set some reminders and see if you can build better habits. Over time it could make a difference.
You can enable up to 10 different reminders with each instance of the indicator. You can select days of the week and time of day. The visibility is fully customizable to suit any colour theme you may want. They dont actually alert - its a silent visual reminder, which is less intrusive and stays on screen for as long as you want.
Remind yourself when CPI releases or bond auctions are about to hit.
Don't get caught off guard by FED speakers or FOMC announcements.
Manage your emotions by writing a motivational reminder.
Build better habits and stay disciplined with reminders not to gamble.
Remind yourself to stay away from the markets when there is low liquidity, and trade during your best hours.
Wait for the market to establish balance and let the text show when to either wait or when to start trading.
Some basic inspiration:
"FOMC - No trading!"
"CPI Data - Expect Volatility"
"Markets closed tomorrow - Plan ahead"
"Take it slow, it's a marathon, not a sprint." - Dakota
"Wait for cheap risk" - HOAG
"Don't diddle in the middle!" - Brian Watts
You can of course write anything you want. Maybe you would like to remind yourself of a specific algo in crude oil or gold, or have other motivational reminders that work for you. If you have any good suggestions put them in the comments for others to use.
You can also use the script to watermark or put a web link on your charts. The indicator is empty by default - the image is just an example of the different types of labels it can show.
Customize the reminders for specific days, times, and events. Position them anywhere on your chart to suit your workflow. Whether you're a day trader or a long-term investor, theres always things to improve. This lets you keep those reminders right on your charts. You can go into the object tree settings and drag the indicator to the top if you want it to hide the candlesticks, and size up the text to really make it cover the chart for when to really stay away, as in the "FOMC" example in the image. The sample image shows a couple of different labels - but the script has no texts by default. It is up to you what to write and what colours to use. Please share it with others that may benefit.
You can add the script more than once if you need more than 10 alerts. You can also use it on multiple panels in TradingView, and it will remember the reminders for each panel. You can use spaces when positioning text in the top and bottom left corners of the screen, where there is sometimes a logo or ticker name obscuring the text. If two reminders display in the same location it will default to show the higher number of the two. Use specific times to change the reminders to make sure they dont overlap if they have the same position and put them on multiple charts if needed.
This script is dedicated to Brian Watts, who started something in me when he kept repeating "Don't diddle in the middle!" and "Where is purple?". IYKYK. I would like to thank him for the inspiration to better myself.
As above, so below.
v01

All Possible Trendlines W/AlertsCore Functionality:
Trendline Detection: The system uses a proprietary algorithm that goes beyond traditional pivot point connection methods. It analyzes price action patterns and market structure to identify potential trendlines that many traders might overlook. This includes not just obvious trendlines, but also subtle ones that could become significant in the future.
Significance Evaluation: Unlike conventional indicators that treat all trendlines equally, the system employs a unique scoring system to evaluate each trendline's importance. This system considers factors such as the number of touch points, the length of the trendline, and its historical reliability in predicting price movements. This allows traders to focus on the most relevant trendlines.
Dynamic Updating: The AITI continuously reassesses and adjusts trendlines as new price data becomes available. This dynamic approach ensures that the indicator adapts to changing market conditions, providing up-to-date and relevant information.
What Makes It Original:
The AITI's originality lies in its holistic approach to trendline analysis. While most indicators focus on identifying a few key trendlines, this system aims to present a complete picture of all possible trendlines in the market. This comprehensive view allows traders to:
- Gain deeper insights into market structure and potential price movements.
- Identify less obvious but potentially significant trendlines that other traders might miss.
- Understand the relative importance of different trendlines, rather than treating all trendlines as equally significant.
The indicator's ability to dynamically update and re-evaluate trendlines in real-time sets it apart from static trendline tools. This ensures that traders always have the most current and relevant information at their disposal.
By providing a more nuanced and complete view of trendlines, the AITI enables traders to make more informed decisions based on a deeper understanding of market structure. This approach to trendline analysis is not readily available in open-source alternatives, making the AITI a valuable tool for traders seeking a more comprehensive technical analysis solution.

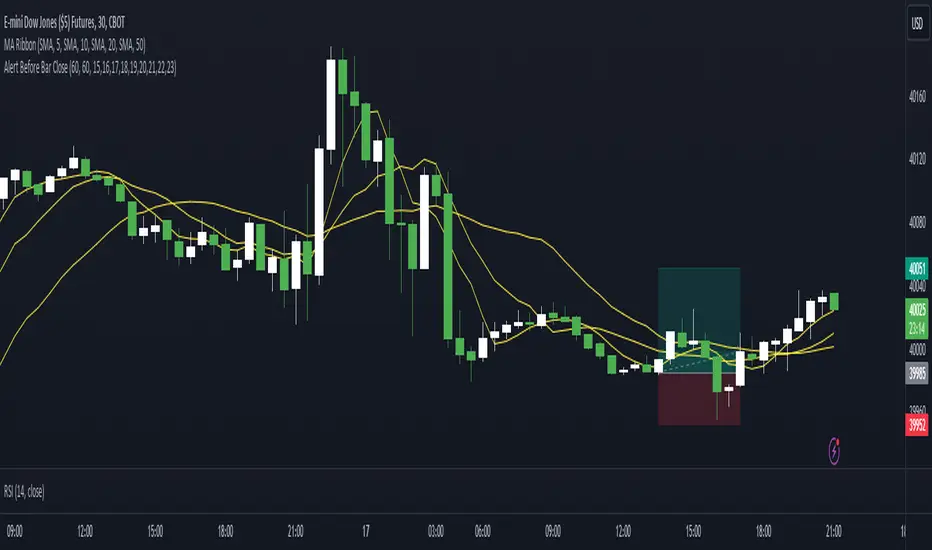
Alert Before Bar Closei.imgur.com
Alert Before Bar Close
==========================
Example Figure
Originality and usefulness
This indicator/alert mechanism is unique in two ways. First, it provides alerts before the close of a candlestick, allowing time-based traders to prepare early to determine if the market is about to form a setup. Second, it introduces an observation time mechanism, enabling time-based traders to observe when the market is active, thereby avoiding too many false signals during electronic trading or when trading is light.
Detail
Regarding the settings (Arrow 1). The first input is to select the candlestick period you want to observe. The second is to notify a few seconds in advance. The third input sets the observation time. For example, if you set "1,2,3,4,5," the alert mechanism will only be activated during the period from 01:00:00 to 05:59:59, consistent with the time zone you set in TradingView. Additionally, I have set it so that the alert will only trigger once per candlestick, so don't worry about repeated alerts.
The alert setup is very simple, too. Follow the steps (Arrow 2, 3) to complete the setup. I have tested several periods and successfully received alerts on both mobile and computer. If anyone encounters any issues, feel free to let me know.
Normalised T3 Oscillator [BackQuant]Normalised T3 Oscillator
The Normalised T3 Oscillator is an technical indicator designed to provide traders with a refined measure of market momentum by normalizing the T3 Moving Average. This tool was developed to enhance trading decisions by smoothing price data and reducing market noise, allowing for clearer trend recognition and potential signal generation. Below is a detailed breakdown of the Normalised T3 Oscillator, its methodology, and its application in trading scenarios.
1. Conceptual Foundation and Definition of T3
The T3 Moving Average, originally proposed by Tim Tillson, is renowned for its smoothness and responsiveness, achieved through a combination of multiple Exponential Moving Averages and a volume factor. The Normalised T3 Oscillator extends this concept by normalizing these values to oscillate around a central zero line, which aids in highlighting overbought and oversold conditions.
2. Normalization Process
Normalization in this context refers to the adjustment of the T3 values to ensure that the oscillator provides a standard range of output. This is accomplished by calculating the lowest and highest values of the T3 over a user-defined period and scaling the output between -0.5 to +0.5. This process not only aids in standardizing the indicator across different securities and time frames but also enhances comparative analysis.
3. Integration of the Oscillator and Moving Average
A unique feature of the Normalised T3 Oscillator is the inclusion of a secondary smoothing mechanism via a moving average of the oscillator itself, selectable from various types such as SMA, EMA, and more. This moving average acts as a signal line, providing potential buy or sell triggers when the oscillator crosses this line, thus offering dual layers of analysis—momentum and trend confirmation.
4. Visualization and User Interaction
The indicator is designed with user interaction in mind, featuring customizable parameters such as the length of the T3, normalization period, and type of moving average used for signals. Additionally, the oscillator is plotted with a color-coded scheme that visually represents different strength levels of the market conditions, enhancing readability and quick decision-making.
5. Practical Applications and Strategy Integration
Traders can leverage the Normalised T3 Oscillator in various trading strategies, including trend following, counter-trend plays, and as a component of a broader trading system. It is particularly useful in identifying turning points in the market or confirming ongoing trends. The clear visualization and customizable nature of the oscillator facilitate its adaptation to different trading styles and market environments.
6. Advanced Features and Customization
Further enhancing its utility, the indicator includes options such as painting candles according to the trend, showing static levels for quick reference, and alerts for crossover and crossunder events, which can be integrated into automated trading systems. These features allow for a high degree of personalization, enabling traders to mold the tool according to their specific trading preferences and risk management requirements.
7. Theoretical Justification and Empirical Usage
The use of the T3 smoothing mechanism combined with normalization is theoretically sound, aiming to reduce lag and false signals often associated with traditional moving averages. The practical effectiveness of the Normalised T3 Oscillator should be validated through rigorous backtesting and adjustment of parameters to match historical market conditions and volatility.
8. Conclusion and Utility in Market Analysis
Overall, the Normalised T3 Oscillator by BackQuant stands as a sophisticated tool for market analysis, providing traders with a dynamic and adaptable approach to gauging market momentum. Its development is rooted in the understanding of technical nuances and the demand for a more stable, responsive, and customizable trading indicator.
Thus following all of the key points here are some sample backtests on the 1D Chart
Disclaimer: Backtests are based off past results, and are not indicative of the future.
INDEX:BTCUSD
INDEX:ETHUSD
BINANCE:SOLUSD

Price alert multi symbols (Miu)This indicator won't plot anything to the chart.
Please follow steps below to set your alarms based on multiple symbols' prices:
1) Add indicator to the chart
2) Go to settings
3) Check symbols you want to receive alerts (choose up to 8 different symbols)
4) Set price for each symbol
5) Once all is set go back to the chart and click on 3 dots to set alert in this indicator, rename your alert and confirm
6) You can remove indicator after alert is set and it'll keep working as expected
What does this indicator do?
This indicator will generate alerts based on following conditions:
- If price set is met for any symbol
Once condition is met it will send an alert with the following information:
- Symbol name (e.g: BTC, ETH, LTC)
- Price reached
This script requests current price for each symbol through request.security() built-in function. It also requests amount of digits (mintick) for each symbol to send alerts with correct value.
This script was developed to attend a demand from a comment in other published script.
Feel free to give feedbacks on comments section below.
Enjoy!
FOMO Alert (Miu)This indicator won't plot anything to the chart.
Please follow steps below to set your alarms based on price range variation:
1) Add indicator to the chart
2) Go to settings
3) Choose timeframe which will be used to calculate bars
4) Choose how many bars which will be used to calculate max and min range
5) Choose max and min range variation (%) to trigger alerts
5) Choose up to 6 different symbols to get alert notification
6) Once all is set go back to the chart and click on 3 dots to set alert in this indicator, rename your alert and confirm
7) You can remove indicator after alert is set and it'll keep working as expected
What does this indicator do?
This indicator will generate alerts based on following conditions:
- If min and max prices reach the range (%) from amount of bars on timeframe set for any symbol checked it will trigger an alert.
- If next set of bars reaches higher range than before it will trigger an alert with new data
- If next set of bars doesn't reach higher range than before it will not trigger alerts, even if they are above the range set (this is to prevent the alert to keep triggering with high frequency)
Once condition is met it will send an alert with the following information:
- Symbol name (e.g: BTC, ETH, LTC)
- Range achieved (e.g: 3,03%)
- Current symbol price and current bar direction (e.g: 63,477.1 ▲)
This script will request lowest and highest prices through request.security() built-in function from all different symbols within the range set. It also requests symbols' price (close) and amount of digits (mintick) for each symbol to send alerts with correct value.
This script was developed with main purpose to send alerts when there are strong price movements and I decided to share with community so anyone can set different parameters for different purposes.
Feel free to give feedbacks on comments section below.
Enjoy!

High Volume AlertThe High Volume Alert Script is developed for all traders focusing on volume analysis in their trading strategies, providing alerts for unusually high trading volumes during specified trading sessions.
Functionality:
Volume Moving Average Calculation:
Average Volume = Moving Average(Volume) = Sum of last the x last candles Volume
Where n is the user-defined period for the moving average calculation (denoted as movingaverageinput in the script. This moving average serves as the baseline to compare current volume levels against historical averages.
High Volume Detection:
HighVolume = CurrentVolume >= (MA(Volume) x HighVolumeRatio)
Here, HighVolumeRatio is a user-defined multiplier that sets the threshold for what is considered high volume. If the current volume exceeds this threshold (the product of the moving average of volume and the HighVolumeRatio ), the script identifies this as a high-volume event.
Session Filtering:
The script further refines these alerts by ensuring they only trigger during the specified trading session, enhancing relevance for traders interested in specific market hours. This session is defined by the sess and timezone parameters.
Visualisation and Alerts:
If high volume is detected (HighVolume = True), the script colors the volume bar with the highVolumeColor . If the option is selected, it also changes the color of the candlestick to either highVolumeCandleColorUp (for bullish candles) or highVolumeCandleColorDown (for bearish candles), depending on the price movement within the high-volume period. An alert is generated through the alertcondition function when high volume is detected during the specified session, notifying the trader of potentially significant market activity.
Application in Trading:
This indicator serves traders who prioritize volume as a leading indicator of potential price movement. High trading volumes may indicate the presence of significant market activity, often associated with events like news releases, market openings, or large trades, which can precede price movements.
Originality and Practicality:
This script is self-developed, aiming to fill the gap in automatic ratio adjusted volume alerts within the TradingView environment.
Conclusion:
The High Volume Alert Script is an essential tool for traders who integrate volume analysis into their strategy, offering tailored alerts and visual cues for high volume periods.
Compliance and Limitations:
The script complies with TradingView scripting standards, ensuring no lookahead bias and maintaining real-time data integrity. However, its utility depends on the availability on volume data, and please be aware that forex pairs never offer real volume data, this tool is best used with a exchange traded symbol.
Alert on Candle CloseAlert on Candle Close is a simple indicator allowing you to set alerts when a candlestick closes.
Instructions for use
From the chart window, click on "Indicators" and search for "Alert on Candle Close".
Click on "Alert on Candle Close" to add the indicator to your chart. Click on the star icon to add it to your favourites to easily access later.
Set your chart timeframe to the timeframe you wish to alert on. For example, to create an alert when a 4h candlestick closes, set your chart to the "4h" timeframe.
Hover over the "Alert on Candle Close" indicator which has been added to your chart and click the ellipsis "..." icon, then click "Add alert on Alert on Candle Close" or use the keyboard shortcut "Alt+A" from the chart.
In the alert pop-up window, make sure "Condition" is set to "Alert on Candle Close" and "Trigger" is set to "Once Per Bar".
Optionally, you can set a custom expiry for the alert, give the alert a name and customise the alert message. You can configure notification settings from the "Notifications" tab.
Click "Create" and your alert is set up!
Each alert is tied to the timeframe and chart it was created on, so you can change the timeframe or asset and create more alerts by repeating the above process.
Note : this indicator is only designed to work with time-based chart types, such as Bars, Candles or Heikin Ashi. It will not work for non-time charts such as Renko.
FAQs
Why do my alerts sometimes not fire as soon as the candle closes?
This is a limitation with Pine Script's execution model. Indicators are calculated whenever a price or volume change occurs i.e. when a new trade happens. For illiquid or slow moving markets, there may be some time between when a candle closes and the next trade, leading to a delay in the alert triggering. The alert will trigger on the next tick of data on the chart.
Why can't I create more alerts?
TradingView has a limit on the number of active technical alerts you can have based on your membership tier. To configure more alerts, consider upgrading your TradingView plan to a higher tier. See a comparison of TradingView plans at www.tradingview.com
My alert only fired once, how can I get it to keep working?
When configuring the alert in the alert pop-up window, make sure you set "Trigger" to "Once Per Bar" and "Expiration" to "Open-ended alert".

CoinFxPro Range indicator V 1.0This indicator has a structure that combines daily and weekly pivot levels, moving averages, and strength index-linked oscillators. The purpose of the indicator is designed to analyze price movements and identify potential trend reversals. Daily pivot levels are helpful in identifying critical support and resistance zones, while moving averages and oscillators indicate overbought or oversold situations in the price.
It is very simple to use and simple in appearance.
Triangular Signals appearing on the chart screen come when the price touches the daily or weekly support and resistance levels.
If you want the signals to be received less or more healthy, I added the filtering feature. In this way, you can filter the incoming signals through the volume or volatility filter, so that less signals are received.
On the other hand, the 4 timeframe rsi values of the price for daily use of the indicator are also given in the table.
You can change the RSI timeframes as you wish.
In this way, it is seen more clearly whether the signal is healthy and provides convenience while trading.
Evaluation of incoming signals;
First of all, when the signal occurs, pay attention to whether the RSI values that occur in the timeframe you trade and in other timeframes are overbought (red) or oversold (green).
When the signal comes, I buy or sell, especially if the RSI values in the 5 minutes, 15 minutes and 1 hour time periods are overbought or oversold.
If you wish, you can try a different strategy for yourself.
After the healthiest of the signals on the chart comes, the RSI values are also at overbought or oversold levels in 5-15 minutes and 1 hour timeframes and if there is a Trendline line above or below the price, it is out of that region.
A healthy buying or selling transaction can be made.
It should be noted that since risk = return, high risk means high return. High risk must be taken for high returns. Therefore, I recommend that you do not exceed 10% of your capital as margin when trading with leverage.
When trading, I always recommend trading with additional confirmation from a different indicator.
I also added a filtering feature to the indicator to block market structure related variables. Those who want to use can also use filtering.
I have added the automatic trendline for ease of trading. You can increase or decrease the number of trend lines as you wish.
I just published the indicator for daily use.
[Rygel] Dual time frame Bollinger Bands with signals and alertsThis indicator displays two Bollinger Bands coming from two different time frames, chart's current one and a higher one.
It analyzes these two Bollinger Bands data and combines them with RSI, MFI and MACD divergences and SuperTrend to identify areas of opportunity where price is the most likely to be at a local top or bottom.
It uses probabilistic data, the Bollinger Bands, to identify convergence areas where the price is statistically overbought or oversold simultaneously at two different time frames, it then looks for signs of a trend exhaustion, using RSI, MFI and MACD divergences, and finally it looks for an early confirmation of a trend reversal, using SuperTrend data with aggressive settings.
This indicator does not produce buy and sell signals. You won't get a buy for every sell or a sell for every buy. In a bearish trend, you may get multiple consecutive bullish signals and in a bullish trend multiple bearish signals.
It is meant to help you to identify and to alert you about areas of opportunity where you could, for instance, consider taking some profits or opening a trade.
It is meant to support your investment or trading decisions, not to induce them.
SIGNALS
This indicator generated multiple types of signals. Diamonds are better than squares. Colored ones are better than grey ones.
Green square: a bullish signal confirmed by a regular divergence
Red square: a bearish signal confirmed by a regular divergence
Blue square: a bullish signal confirmed by a hidden divergence (disabled by default as these signals are less reliable)
Orange square: a bearish signal confirmed by a hidden divergence (disabled by default as these signals are less reliable)
Diamonds: same as the square signals but the signal is forming a divergence with a previous one. Diamond signals are always stronger (i.e. more reliable) than square signals.
Grey signals: same as the previous ones but for weaker signals. These signals appear when price in the current time frame is overbought or oversold but only close to be at the higher timeframe. (disabled by default as these signals are less reliable)
When a weak signal follows a strong one and creates a MACD divergence with it, it will be considered as a strong signal and displayed as a colored signal, even when weak signals are disabled.
When a strong signal follows a weak one, forming a MACD divergence, it will be shown as a diamond signal, even when weak signals are disabled.
Most reliable signals are green and red diamonds.
SETTINGS
Bollinger Bands
Source: the source used to calculate the Bollinger Bands ("close" by default)
Length: the moving-average length of the Bollinger Bands (20 by default)
You will most likely have no need to change these settings. If you're wondering what they actually do, you should most likely not touch them.
Main channel standard deviation: the standard deviation used to calculate the classical Bollinger Bands channel. (2.0 by default)
Outer bands standard deviation: additional channels outside the main one, using a larger standard deviation. (3.0 by default)
Theoretically, with a 1.0 standard deviation, around 68% of the price action should be contained within the Bollinger Bands.
With a 2.0 standard deviation, around 95%.
With a 3.0 standard deviation, around 99.7%.
With a 4.0 standard deviation, around 99.99%.
But as security prices returns have no actual statistical distribution, these probabilities don't strictly apply to Bollinger Bands. According to Wikipedia, studies have found that with a 2.0 standard deviation, only about 88% (85–90%) of the price data remain with the Bollinger Bands, instead of the theoretical 95%.
The higher you set the values, the less signals you'll get.
You should most likely keep the main channel standard deviation between 2 and 3 and add between +0.5 and +1 for the outer bands.
Most commonly used value for Bollinger Bands is 2.0.
Current time frame
Show current time frame Bollinger Bands: these are the Bollinger Bands you're used to. (enabled by default)
Show current time frame outer bands: add two additional bands outside the main channel using a larger standard deviation. (enabled by default)
Higher time frame
Show higher time frame Bollinger Bands: display secondary Bollinger Bands from a higher time frame. Time frames are configured in the below "Time frames" section. (enabled by default)
Show higher time frame outer bands: add two additional bands outside the main channel using a larger standard deviation (enabled by default)
Overbought and oversold
Show oversold and overbought background: add a background to the higher time Bollinger Bands whose color depends on the dual time frame Bollinger Bands oversold / overbought status. (enabled by default)
Asset is considered overbought/oversold when its price is outside of the Bollinger Bands' main channel.
Asset is considered strongly overbought/oversold when its price is outside of the Bollinger Bands' outer bands.
Dark red: both time frame are overbought (outside the main channel)
Red: one time frame is strongly overbought (outside the outer bands) and the other one is overbought (outside the main channel)
Bright red: both time frame are strongly overbought (outside the outer bands)
Dark green: both time frame are oversold (outside the main channel)
Green: one time frame is strongly oversold (outside the outer bands) and the other one is oversold (outside the main channel)
Bright green: both time frame are strongly oversold (outside the outer bands)
Signals
Show signals: display signals when an area of opportunity is detected. Read the introduction and the Signals section for more information. (enabled by default)
Show weak signals: display signals although at the higher time frame price is not yet overbought or oversold but close to be (disabled by default)
Divergences
Use MACD for divergences (enabled by default)
Use MFI for divergences (enabled by default)
Use RSI for divergences (enabled by default)
At least one source of divergences must be enabled for signals to work.
Enable hidden divergences: signals don't use hidden divergences by default as they generate more false positives than regular divergences. You can enable them to get more signals, it can be especially useful at high time frames (like weekly, monthly, etc.) where signals are rarer. (disabled by default)
Show divergences: draw MACD, MFI and RSI divergences on the chart. (disabled by default)
Green: regular bullish divergence
Red: regular bearish divergence
Blue: hidden bullish divergence
Orange: hidden bearish divergence
Confirmation
Confirmation speed: a faster confirmation speed will generate more false positive signals, a slower one will produce delayed but more reliable signals.
Fastest: don't wait for a SuperTrend confirmation, only wait for a divergence confirmation. Lot of false positives.
Fast: wait for a fast SuperTrend confirmation (SuperTrend factor = 1).
Medium: wait for a slower but more reliable SuperTrend confirmation (SuperTrend factor = 2). Fewer false positives but more lagging signals.
Slow: wait for an even slower but very reliable SuperTrend confirmation (SuperTrend factor = 3). Very few false positives but very late signals.
Time frames
You can define the higher time frames you wish to use here.
Default values try to adhere to a x6 to x8 ratio, x4 to x12 at maximum.
Some pairs are more significant than others, like 4 hour + daily, daily + weekly and weekly + monthly.
1 second: 10 seconds
5 seconds: 30 seconds
10 seconds: 1 minute
15 seconds: 2 minutes
30 seconds: 3 minutes
1 minute: 10 minutes
2 minutes: 15 minutes
3-4 minutes: 30 minutes
5-9 minutes: 45 minutes
10-11 minutes: 1 hour
12-14 minutes: 1 hour
15-29 minutes: 2 hours
30-44 minutes: 4 hours
45-59 minutes: 6 hours
1 hour: 8 hours
2 hours: 12 hours
3 hours: 1 day
4-5 hours: 1 day
6-7 hours: 2 days
8-11 hours: 3 days
12-23 hours: 4 days
1 day: 1 week
2 days: 2 weeks
3 days: 3 weeks
4 days: 1 month
5 days: 1 month
6 days: 1 month
1 week: 1 month
2 weeks: 2 months
3 weeks: 3 months
1 month: 6 months
2 months: 9 months
3 months: 12 months
4 months: 15 months
5 months: 21 months
6 months: 24 months
Time frames use the TradingView units:
s = seconds
h = hours
D = days
W = weeks
M = months
no unit = minutes
Time frame strings follow these rules:
They are composed of the multiplier and the time frame unit, e.g., “1S”, “30” (30 minutes), “1D” (one day), “3M” (three months).
The unit is represented by a single letter, with no letter used for minutes: “S” for seconds, “D” for days, “W” for weeks and “M” for months.
When no multiplier is used, 1 is assumed: “S” is equivalent to “1S”, “D” to “1D, etc. If only “1” is used, it is interpreted as “1min”, since no unit letter identifier is used for minutes.
There is no “hour” unit; “1H” is not valid. The correct format for one hour is “60” (remember no unit letter is specified for minutes).
The valid multipliers vary for each time frame unit:
- For seconds, only the discrete 1, 5, 10, 15 and 30 multipliers are valid.
- For minutes, 1 to 1440.
- For days, 1 to 365.
- For weeks, 1 to 52.
- For months, 1 to 12.
Styles
You can configure the appearance of the Bollinger Bands, the overbought / oversold background, the divergences and the signals here.
Advanced - MACD
Settings used for the MACD divergences. You most likely won't need to change these values, especially if you need them to be explained.
Advanced - MFI
Settings used for the MACD divergences. You most likely won't need to change these values, especially if you need them to be explained.
Advanced - RSI
Settings used for the MACD divergences. You most likely won't need to change these values, especially if you need them to be explained.
Advanced - SuperTrend
Settings used for the MACD divergences. You most likely won't need to change these values, especially if you need them to be explained.
ALERTS
Any signal: a bullish or bearish signal has been detected.
Bullish signal: a bullish signal has been detected.
Bullish signal with divergence: a bullish signal forming a divergence with a previous bullish signal has been detected.
Bearish signal: a bearish signal has been detected.
Bearish signal with divergence: a bearish signal forming a divergence with a previous bearish signal has been detected.
Overbought/oversold = asset price is outside of the Bollinger Bands' main channel.
Strongly overbought/oversold = asset price is outside of the Bollinger Bands' outer bands.
Current time frame - Entering overbought: asset is now overbought at the current time frame.
Current time frame - Exiting overbought: asset is not overbought anymore at the current time frame.
Current time frame - Entering strongly overbought: asset is now strongly overbought at the current time frame.
Current time frame - Exiting strongly overbought: asset is not strongly overbought anymore at the current time frame.
Current time frame - Entering oversold: asset is now oversold at the current time frame.
Current time frame - Exiting oversold: asset is not oversold anymore at the current time frame.
Current time frame - Entering strongly oversold: asset is now strongly oversold at the current time frame.
Current time frame - Exiting strongly oversold: asset is not strongly oversold anymore at the current time frame.
Higher time frame - Entering overbought: asset is now overbought at the higher time frame.
Higher time frame - Exiting overbought: asset is not overbought anymore at the higher time frame.
Higher time frame - Entering strongly overbought: asset is now strongly overbought at the higher time frame.
Higher time frame - Exiting strongly overbought: asset is not strongly overbought anymore at the higher time frame.
Higher time frame - Entering oversold: asset is now oversold at the higher time frame.
Higher time frame - Exiting oversold: asset is not oversold anymore at the higher time frame.
Higher time frame - Entering strongly oversold: asset is now strongly oversold at the higher time frame.
Higher time frame - Exiting strongly oversold: asset is not strongly oversold anymore at the higher time frame.
Dual time frame - Entering overbought: asset is now overbought at current and higher time frames.
Dual time frame - Exiting overbought: asset is not overbought anymore at current and higher time frames.
Dual time frame - Entering oversold: asset is now oversold at current and higher time frames.
Dual time frame - Exiting oversold: asset is not oversold anymore at current and higher time frames.
Dual time frame - Entering strongly overbought: asset is now strongly overbought at current and higher time frames.
Dual time frame - Exiting strongly overbought: asset is not strongly overbought anymore at current and higher time frames.
Dual time frame - Entering strongly oversold: asset is now strongly oversold at current and higher time frames.
Dual time frame - Exiting strongly oversold: asset is not strongly oversold anymore at current and higher time frames.
ABOUT THE HIGHER TIME FRAME BOLLINGER BANDS
Using a classical higher time frame Bollinger Bands would produce lagging data. For instance, if we are using a weekly BB at the daily time frame, we'll have to wait up to 7 days for the weekly bar to close to get the actual final weekly BB values. Instead, this indicator generates real time higher time frame Bollinger Bands by multiplying the moving average length of the Bollinger Bands by the higher time frame / current time frame ratio. For instance, a weekly BB in the daily time frame will use a x7 ratio (i.e. a 20 * 7 = 140 days MA BB).
It produces slightly different but very similar bands that are as meaningful and can be used in real time at lower time frames.
Alternatives would have been to wait up to seven days for signals to be finalized, which would have render them meaningless. Or to use previous week data, which would have made the signal inaccurrate.
To sum up, weekly Bollinger Bands use a 20 weeks moving average updated one time a week. In the daily time frame, this indicator also use a 20 weeks (140 days) moving average but updated daily instead of weekly.
A comparison between a traditional higher time frame Bollinger Bands vs the ones used by this indicator:
Blue and orange lines are the actual weekly BBs, grey ones are the daily updated ones.
ABOUT THE DIVERGENCES
This indicator uses the same divergences algorithm as my other indicators:
- RSI with divergences
- MACD with divergences
- Trend Reversal Indicator
You'll find more information about this algorithm on my RSI page.