Analysis


Hawkeye Trend+StopsHawkeye Trend+Stops -- the tool that breathes with market condition
With Trend+Stops you get a true sense of the market trend rather than opinions from the financial media.
This powerful indicator tells you when a trend is commencing, in congestion and where the correct exit is. You’ll have the confidence to stay in a trend, a feat that proves difficult for most novice traders.
Trend+Stops is based on the Hawkeye Volume algorithm of pattern recognition and average true range. Using this tool will stop you from having "opinions" on market direction and allow you to take control of your trading.
Trend+Stops overcomes two of the biggest hurdles to successful trading:
Where the trend is at the given moment (and its momentum)
Where your stop exit should be
The Hawkeye Trend+Stops Indicator
One of the most difficult tasks in trading is to know when the market you are trading is in a trend, and when it is not. It is the correct selection of trades in trending markets that makes the difference between a profitable trade, and one that gets you stopped out with a loss.
The problem is that markets spend more time moving sideways than they do in a trend. Consequently many traders find themselves in a trade they believe is the start of a trend, only to discover that the market moved sideways, with the position being closed out at a loss. This is the single most frustrating part of trading, and it accounts for more traders making overall losses on their account than any other factor -- Hawkeye Trend+Stops


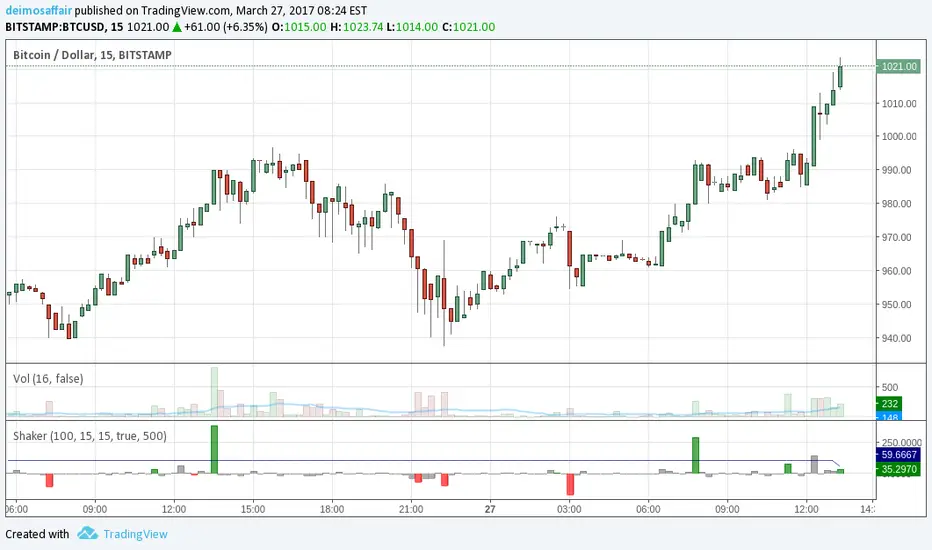
Cooltoyz: market shaker v1.0Panicking over a big ass candle? wondering what's happening on a flat market? Despair no more, this indicator could help with that :)
The market Shaker calculates the price differences, and weights them with the volume used for the move. This volume is not the plain value, but a measure of the past X volume candles.
Examples:
price moves 3%, but with a volume of only ~80% of last candles. looks like weak move
price moves 0.4%, but the volume was a massive 220% bigger than last candles. something happened, even if the market absorbed it all, better pay attention.
in each case, the shaker indicator makes the calculated value bigger/smaller to account for the volume weight of the move.
It's also i real time, the current candle weight is considered on how much time it remains to close. Example, on the 1H chart, if the last candle is 45min to close, the values for the volume are weighted to 25%, since is only 15min "old", while all the other candles are 1h, so the candle is only 25% of it's time to close.
The indicator options has the arguments required to tune the indicator, the candles minutes must match the chart, or the results go crazy.
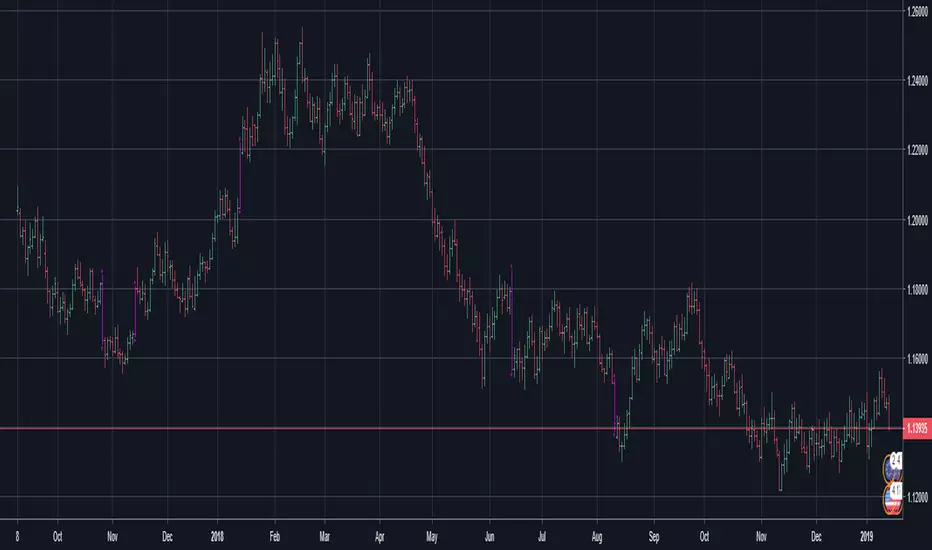
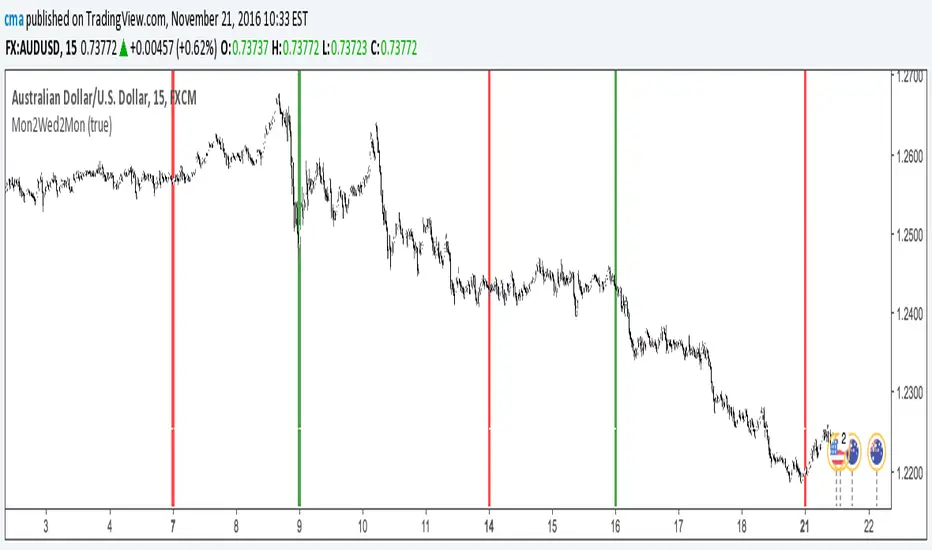
The Block IndicatorThis indicator finds Mondays and Wednesdays and draws a vertical line, so you can easy do your bias or trend analysis.
Options
You can turn off/on the Wednesday's line.
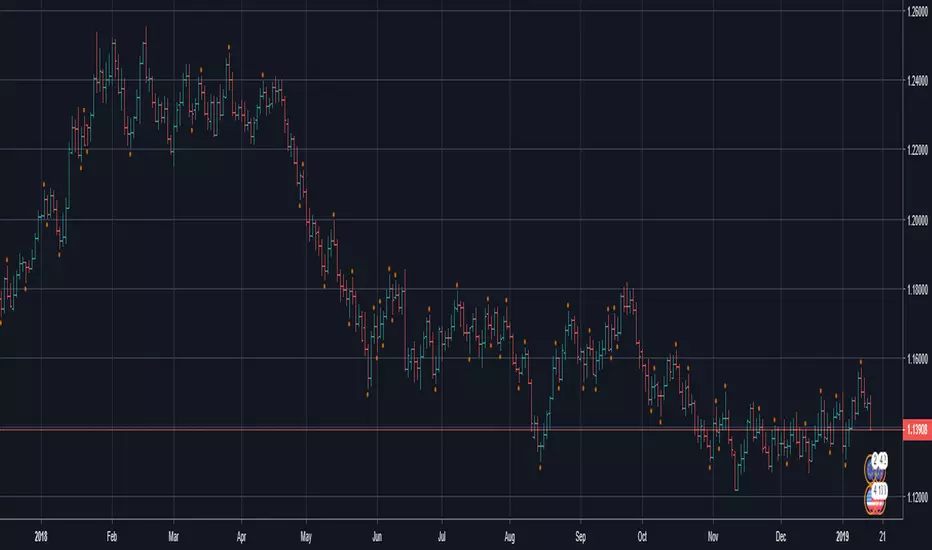
2% candlePart of my strategy involves entering a trade based on a candle on a 5-min chart being < 2% (ignoring major volatility).
I got tired of calculating the range of a single candle either in my head or on a calculator, so I wrote this up. Feel free to share it.
Shows the %move of any single candle, default horizontal lines are 1% & 2%, can be changed by clicking the gear icon next to the indicator after you have added the indicator to your chart. Works on any timeframe, 5m, 1h, 1d, etc , obviously
the higher the timeframe, the larger the move.

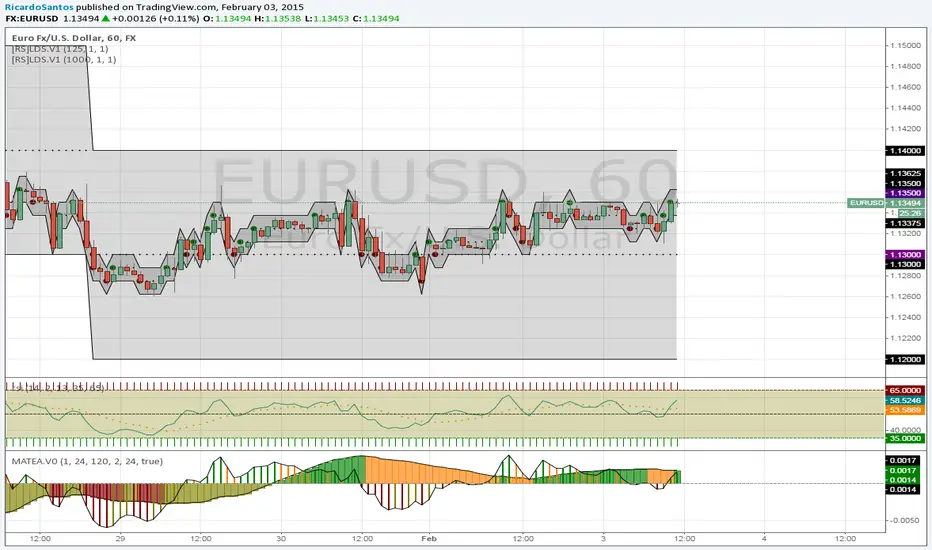
[RS]Moving Average Trend Expansion Analysis V0experimental: analyzing the differences between price closure and multiple moving averages to discern movement and direction of market.
upper signal is the long trend, while the lower signal symbolizes faster movements within the trend.