Cumulative TICK Trend[Pt]Cumulative TICK Trend indicator is a comprehensive trading tool that uses TICK data to define the market's cumulative trend. Trend is shown on ATR EMA bands, which is overlaid on the price chart. Cumulative TICK shown on the bottom pane is for reference only.
Main features of the Cumulative TICK Trend Indicator include:
Selectable TICK Source: You have the flexibility to choose your preferred TICK source from the following options, depending on the market you trade: USI:TICK, USI:TICKQ, USI:TICKI, and USI:TICKA.
TICK Data Type: Select the type of TICK data to use, options include: Close, Open, hl2, ohlc4, hlc3.
Simple Moving Average (SMA): You can choose to apply an SMA on the calculated Cumulative TICK values with a customizable length.
Average True Range (ATR) Bands: It provides the option to display ATR bands with adjustable settings. This includes the ATR period, EMA period, source for the ATR calculation, and the ATR multiplier for the upper band.
Trend Color Customization: You can customize the color of the bull and bear trends according to your preference.
Smooth Line Option: This setting allows you to smooth the ATR Bands with a customizable length.
How it Works:
This indicator accumulates TICK data during market hours (9:30-16:00) as per the New York time zone and resets at the start of a new session or the end of the regular session. This cumulative TICK value is then used to determine the trend.
The trend is defined as bullish if the SMA of cumulative TICK is equal to or greater than zero and bearish if it's less than zero. Additionally, this indicator plots the ATR bands, which can be used as volatility measures. The Upper ATR Band and Lower ATR Band can be made smoother using the SMA, according to the trader's preference.
The plot includes two parts for each trend: a stronger color (Red for bear, Green for bull) when the trend is ongoing, and a lighter color when the trend seems to be changing.
Remember, this tool is intended to be used as part of a comprehensive trading strategy. Always ensure you are managing risk appropriately and consulting various data sources to make informed trading decisions.
ATR

custom Bollinger bands with filters - indicator (AS)-----------Description-------------
This indicator is basically Bollinger bands with many ways to customize. It uses highest and lowest values of upper and lower band for exits. I think something is wrong with the script but cant find any mistakes – most probably smoothing. The ATR filter is implemented but is working incorrectly. In code you can also turn it into strategy but I do not recommend it for now as it is not ready yet.
So this is my first script and I am looking for any advice, ideas to improve this script, sets of parameters, markets to apply, logical mistakes in code or any ideas that you may have. Indicator was initially designed for EURUSD 5MIN but I would be interested in other ideas.
-----------SETTINGS--------------
---START - In starting settings we can choose
Line 1: what parts to use BB/DC/ATR
Line 2: what parts to plot on chart
Line 3 Whether or not apply smoothing to BB or ATR filter
Line 4 Calculate deviation for BB from price or Moving average
Line 5 Fill colors and plot other parts for debug (overlay=false)
Line 6:( for strategy) – enable Long/Short Trades
---BB and DC – here we modify Bollinger bands and Donchian
Line 1: Length and type of BB middle line and also length of DC from BB
Line 2: Length and type of BB standard deviation and multiplier
Line 3: Length and type of BB smoothing and %width for BB filter
---ATR filter – (not ready fully yet)
Line 1: type and length of ATR
Line 2: threshold and smoothing value of ATR
---DATE and SESSION
Line 1: apply custom date or session?
Line 2: session hours settings
Line 3:Custom starting date
Line 4: Custom Ending date
-----------HOW TO USE--------------
We open Long if BB width is bigger than threshold and close when upper band is no longer highest in the period set. Exact opposite with Short

Volatility Adjusted ADX (VADX)I sincerely wish to express my heartfelt gratitude to the vast community of coders on TradingView who have previously crafted various Average Directional Index (ADX) scripts. Their innovative approaches have laid a solid foundation, and I'm incredibly grateful for their inspiring work. In essence, their accomplishments have ignited the creative spark that led to the development of the Volatility Adjusted ADX (VADX) script.
VADX is not your run-of-the-mill script. It distinguishes itself from the myriad of ADX indicators on TradingView due to its unique volatility-adjustment mechanism. The primary purpose of this script is to augment the ADX's ability to quantify trend strength by introducing a layer of sensitivity to volatility shifts through the Average True Range (ATR). The interaction between these two crucial market measurements is where the novelty lies.
While the standard ADX does an excellent job of diagnosing the trend's vigor, its evaluation can sometimes be skewed when markets oscillate between periods of high and low volatility. Integrating the ATR – a reliable indicator of market volatility – into the ADX calculation mitigates this limitation, resulting in a more robust, volatility-adjusted trend strength measurement.
The specifics of the mathematical adjustment, our secret ingredient, will remain undisclosed for proprietary reasons. Nevertheless, I assure you that it creates a dynamic and balanced interplay between the trend strength and volatility, enabling a more nuanced understanding of the market.
The VADX script is user-friendly and includes three main inputs: ADX Smoothing, DI Length, and ATR Length. The ADX Smoothing parameter refines the ADX calculation, DI Length determines the period for the Directional Movement System calculation, and the ATR Length sets the period for the Average True Range.
Using this indicator is as easy as pie. After adding it to your chart, VADX will manifest itself as a separate panel beneath your price chart. When the VADX is escalating, it indicates that the strength of the trend is intensifying. Conversely, a declining VADX suggests diminishing trend strength. Two horizontal lines at the 25 and 75 levels provide a simple interpretation guide – they denote weak and strong trend phases, respectively.
This robust indicator is adaptable and can be effectively applied across multiple markets - from stocks, forex, and futures to cryptocurrencies. It also delivers valuable insights on any timeframe. However, as with any new indicator, I highly recommend initial testing and optimization to match your unique trading style and objectives.
To wrap up, the VADX indicator sets itself apart with its novel volatility adjustment, a feature not commonly found in existing TradingView scripts. This distinctive capability affords traders a more comprehensive view of the trend's strength by accounting for market volatility, adding an extra layer of depth to traditional ADX interpretation. I sincerely hope that this script enriches your trading arsenal and assists you in navigating the market with enhanced precision. As always, happy trading!

Limit Order + ATR Stop-Loss [TANHEF]This indicator enables interactive placement of limit or stop-limit orders with a trailing ATR stop-loss and optional profit target (with alerts). Refer to the images below for further clarification.
Why use a trailing stop-loss?
A trailing stop-loss serves as an exit strategy when price moves against you, while also allowing you to adjust the exit point further into profit when price moves favorably. The ATR (Average True Range), a reliable measure of volatility, acts as an effective risk management tool, functioning as a trailing stop-loss.
Indicator Explanation
Initial indicator placement: Select Long Limit or Long-Stop Limit order.
Change Entry Type: Switch between Long and Short within settings.
Modify entry price: Drag circle, adjust in settings, or re-add indicator to chart.
Optional Profit Target: Use Risk/Reward ratio or specify price.
Entry anticipation: Estimated ATR stop-loss and profit target as blue circles (fluctuates with volatility changes).
Entry triggered: Actual ATR stop-loss and profit target plotted.
Exit conditions: Stop-loss or profit target hit, exit entry.
Update Frequency: Continuously, Bar Open, or Bar Open on entry then continuously.
ATR Overlap: no entry occurs if the ATR overlaps with price (stop-loss 'hit' already on entry bar)
Table: Displays input settings selected.
Show Only On Ticker: Ability to hide indicator on other tickers.
Long Limit
Long Stop-Limit
Short Limit
Short Stop-Limit
Alerts
1. 'Check' alerts to use within indicator settings (entry, trailing stop hit, profit target hit, and failed entry).
2. Select 'Create Alert'
3. Set the condition to 'Limit Order + ATR Stop-Loss''
4. Select create.
Additional details can be added to the alert message using these words in between Curly (Brace) Brackets:
{{trail}} = ATR trailing stop-loss (price)
{{target}} = Price target (price)
{{type}} = Long or Short stop-loss (word)
{{traildistance}} = Trailing Distance (%)
{{targetdistance}} = Target Distance (%)
{{starttime}} = Start time of position (day:hr:min)
{{maxdrawdown}} = max loss
{{maxprofit}} = max profit
{{update}} = stoploss update frequency
{{entrysource}} = entry as 1st bar source (yes/no)
{{triggerentry}} = Wick/Close Trigger entry input
{{triggerexit}} = Wick/Close Trigger exit input
{{triggertarget}} = Wick/Close Trigger target input
{{atrlength}} = ATR length input
{{atrmultiplier}} = ATR multiplier input
{{atrtype}} = ATR type input
{{ticker}} = Ticker of chart (word)
{{exchange}} = Exchange of chart (word)
{{description}} = Description of ticker (words)
{{close}} = Bar close (price)
{{open}} = Bar open (price)
{{high}} = Bar high (price)
{{low}} = Bar low (price)
{{hl2}} = Bar HL2 (price)
{{volume}} = Bar volume (value)
{{time}} = Current time (day:hr:min)
{{interval}} = Chart timeframe
{{newline}} = New line for text

ATR CandlesAverage true range (ATR) is a market volatility indicator used to show the average range prices swing over a specified period.
The ATR Candles indicator has two primary functions. First, it measures a short-term ATR against a longer-term ATR to show if volatility is contracting or expanding.
Secondly, this indicator goes a step further by highlighting individual candles that exceed or fall below user selected ATR thresholds.
Moments of volatility contraction often lead to expansion and vice versa. By using the ATR Candles traders can identify potential imminent breakouts/breakdowns or healthy pullbacks vs a volatile correction.
Indicator Features
Selectable ATR lengths
Selectable threshold limits (1 contraction / 2 expansion)
Calculate current candles range from open / previous close / daily range
Custom colors
Show or hide every element

Fetch ATR + MA StrategyA trend following indicator that allows traders/investors to enter trades for the long term, as it is mainly tested on the daily chart. The indicator fires off buy and sell signals. The sell signals can be turned off as trader can decide to use this indicator for long term buy signals. The buy signals are indicated by the green diamonds, and the red diamonds show the points on then chart where the asset can be sold.
The indicator uses a couple indicators in order to generate the buy signals:
- ADX
- ATR
- Moving Average of ATR
- 50 SMA
- 200 SMA
The buy signal is generated at the cross overs of the 50 and 200 SMA's while the ATR is lower than then Moving Average of the ATR. The buy signal is fired when these conditions are met and if the ADX is lower than 30.
The thought process is as follows:
When the ATR is lower than its moving average, the price should be in a low volatilty environment. An ADX between 25 and 50 signals a Strong trend. Every value below 25 is an absent or weak trend. So entering a trade when the volatilty is still low but increasing, you'll be entering a trade at the start of a new uptrend. This mechanism also filters out lots of false signals of the simple cross overs.
The sell signals are fired every time the 50 SMA drops below the 200 SMA.

Directional ATROANDA:EURUSD
TLDR: A custom volatility indicator that combines Average True Range with candle direction.
The Directional ATR (DATR) is an indicator that enhances the traditional Average True Range (ATR) by incorporating the direction of the candle (bullish or bearish).
This indicator is designed to help traders identify trend strength, potential trend reversals, and market volatility.
Key Features:
Trend Confirmation: Positive and increasing DATR values suggest a bullish trend, while negative and decreasing values indicate a bearish trend. A higher absolute DATR value signifies a stronger trend.
Trend Reversal: A change in the direction of the DATR from positive to negative or vice versa may signal a potential trend reversal.
Volatility: Like the standard ATR, the DATR can be used to gauge market volatility, with larger absolute values indicating higher volatility and smaller values suggesting lower volatility.
Divergence: Divergence between the price and the DATR could signal a potential weakening of the trend and an upcoming reversal.
Overbought/Oversold Levels: Extreme DATR values can be used to identify overbought or oversold market conditions, signaling potential reversals or corrections.
Please note that the Directional ATR is just an indicator, and the interpretations provided are based on its underlying logic.
It is essential to combine the DATR with other technical analysis tools and test the indicator on historical data before using it in your trading strategy. Additionally, consider other factors such as risk management, and your own trading style.
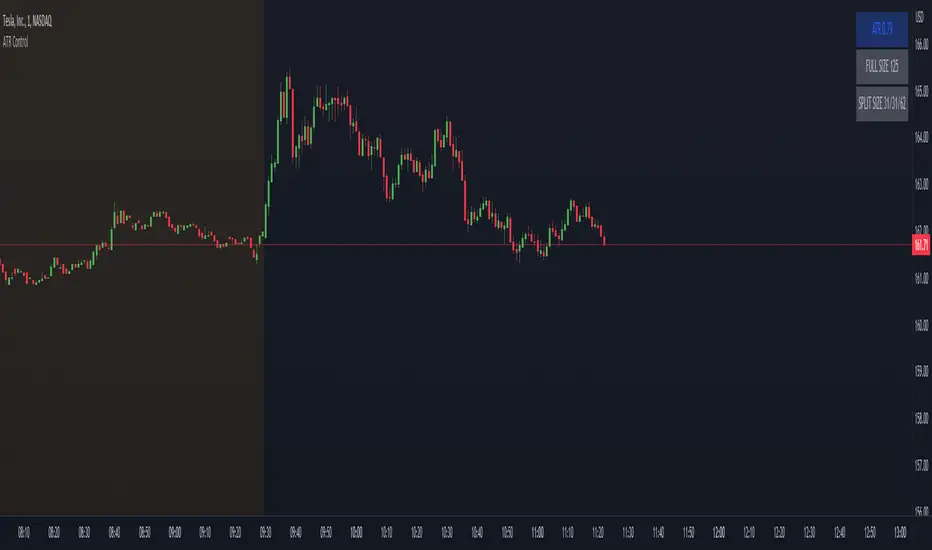
ATR ControlThis indicator shows the following values:
ATR value of the current symbol
Size of the full position based on the maximum risk set
Three sizes that are percents of the full size already present in this indicator
Customizable settings are:
Show/hide single rows
ATR Timeframe
ATR Lenght
First percent of the split to apply
Second percent of the split to apply
Maximum risk
The last percent is automatically calculated using the first two.
Example:
Full size: 500
First percent: 10
Second percent: 40
The third percent is calculated as 100 - first percent - second percent = 50
The split sizes shown are: 50/200/250
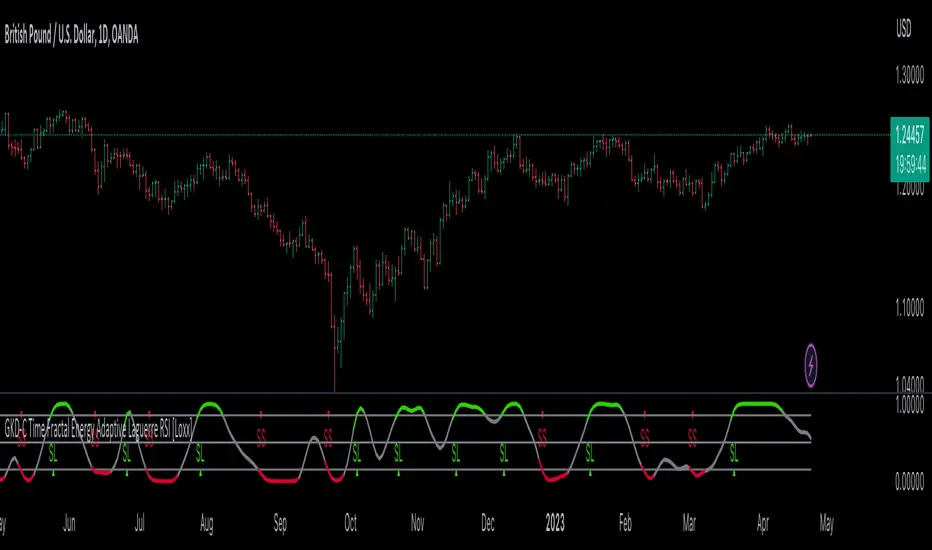
GKD-C Time Fractal Energy Adaptive Laguerre RSI [Loxx]Giga Kaleidoscope GKD-C Time Fractal Energy Adaptive Laguerre RSI is a Confirmation module included in Loxx's "Giga Kaleidoscope Modularized Trading System".
█ GKD-C Time Fractal Energy Adaptive Laguerre RSI
Cracking the Code of Price Momentum with the Time Fractal Energy Adaptive Laguerre RSI Indicator
The Time Fractal Energy adaptive Laguerre RSI is a technical indicator used in financial trading to provide a measure of the momentum of a security's price. It combines several mathematical concepts and techniques, including the Laguerre polynomial, fractal patterns, and adaptive smoothing factors, to provide a more accurate representation of price momentum.
Before diving into the details of how this indicator works, it's important to understand what momentum is and why it's important in trading. Momentum is a measure of the strength and persistence of a trend in a security's price. It can be calculated in various ways, but the basic idea is to look at the change in price over a certain period and use that to infer whether the trend is likely to continue or reverse.
One common momentum indicator is the Relative Strength Index (RSI), which measures the magnitude of recent price changes. The RSI is calculated by dividing the average gain of the price over a certain period by the average loss over the same period, and then normalizing the result to a scale of 0 to 100. A reading above 70 is generally considered overbought, while a reading below 30 is oversold.
While the RSI is a useful tool, it can be prone to noise and false signals, especially in volatile markets. This is where the Time Fractal Energy adaptive Laguerre RSI comes in. It combines the RSI with several other techniques to provide a smoother, more accurate measure of momentum.
Let's break down the components of the Time Fractal Energy adaptive Laguerre RSI in more detail.
-Time Fractal Energy: "Time Fractal" refers to the idea that the behavior of a system can be characterized by self-similar patterns at different time scales. "Energy" in this context refers to the intensity or strength of the fractal pattern. In the context of the indicator, this means that the momentum of a security's price can be characterized by fractal patterns at different time scales.
-Laguerre polynomial: The Laguerre polynomial is a mathematical function used to smooth out data. In the context of the Time Fractal Energy adaptive Laguerre RSI, it is used to filter out noise and highlight underlying trends in the RSI data.
-Adaptive smoothing factors: The smoothing factor used in the Laguerre polynomial is adjusted based on the volatility of the underlying security. This means that the indicator is more responsive to changes in volatility, which can help it perform better in different market conditions.
Now, let's look at how these components come together in the Time Fractal Energy adaptive Laguerre RSI indicator. The code you provided is written in Pine Script, a programming language used on the trading platform TradingView. Here's a step-by-step explanation of what the code does:
1. The input parameters are defined at the top of the code. These include the length of the Average True Range (ATR) period, the price used for the RSI calculation (in this case, the closing price), the smoothing factor, and the upper and lower levels that define overbought and oversold conditions.
2. The Laguerre Filter function is defined using the Laguerre polynomial. This function is used to smooth out the RSI data and filter out noise.
3. The Laguerre RSI function is defined. This function calculates the RSI value based on the Laguerre Filtered data. This step further removes any noise from the RSI calculation, resulting in a smoother, more accurate measure of momentum.
4. The ATR value is calculated based on the highest and lowest prices of the security over the specified period. ATR measures the volatility of a security and is used to determine the adaptive smoothing factor.
5. The gamma value is calculated based on the ATR and the high and low prices of the security over the specified period. Gamma is used as the adaptive smoothing factor in the Laguerre Filter function. The higher the volatility, the higher the gamma value, resulting in a more responsive filter.
6. The Laguerre Filtered RSI value is smoothed further using the gamma value and the smoothing factor. This step helps to reduce any remaining noise in the momentum signal and provide a more accurate representation of the underlying trend.
7. The signal line is created based on the smoothed Laguerre Filtered RSI value from the previous bar. The signal line acts as a trigger for buying or selling, depending on whether it crosses above or below the upper or lower levels defined in the input parameters.
The Time Fractal Energy adaptive Laguerre RSI indicator aims to provide a more accurate measure of momentum by combining several mathematical techniques. The Laguerre polynomial is used to filter out noise and highlight underlying trends, while the adaptive smoothing factor helps to adjust the filter based on the volatility of the underlying security. The result is a smoother, more accurate measure of momentum that can be used to make more informed trading decisions.
It's important to note that no indicator is perfect, and the Time Fractal Energy adaptive Laguerre RSI is no exception. Like any technical indicator, it should be used in combination with other tools and analysis to make informed trading decisions. Additionally, traders should be aware that the indicator may perform differently in different market conditions and should be used in conjunction with other tools to account for changing market conditions.
In conclusion, the Time Fractal Energy adaptive Laguerre RSI is a technical indicator used in financial trading that aims to provide a more accurate measure of momentum. It combines several mathematical techniques, including the Laguerre polynomial, fractal patterns, and adaptive smoothing factors, to filter out noise and highlight underlying trends. While no indicator is perfect, the Time Fractal Energy adaptive Laguerre RSI can be a useful tool when used in combination with other analysis to make informed trading decisions.
Additional Features
This indicator allows you to select from 33 source types. They are as follows:
Close
Open
High
Low
Median
Typical
Weighted
Average
Average Median Body
Trend Biased
Trend Biased (Extreme)
HA Close
HA Open
HA High
HA Low
HA Median
HA Typical
HA Weighted
HA Average
HA Average Median Body
HA Trend Biased
HA Trend Biased (Extreme)
HAB Close
HAB Open
HAB High
HAB Low
HAB Median
HAB Typical
HAB Weighted
HAB Average
HAB Average Median Body
HAB Trend Biased
HAB Trend Biased (Extreme)
What are Heiken Ashi "better" candles?
Heiken Ashi "better" candles are a modified version of the standard Heiken Ashi candles, which are a popular charting technique used in technical analysis. Heiken Ashi candles help traders identify trends and potential reversal points by smoothing out price data and reducing market noise. The "better formula" was proposed by Sebastian Schmidt in an article published by BNP Paribas in Warrants & Zertifikate, a German magazine, in August 2004. The aim of this formula is to further improve the smoothing of the Heiken Ashi chart and enhance its effectiveness in identifying trends and reversals.
Standard Heiken Ashi candles are calculated using the following formulas:
Heiken Ashi Close = (Open + High + Low + Close) / 4
Heiken Ashi Open = (Previous Heiken Ashi Open + Previous Heiken Ashi Close) / 2
Heiken Ashi High = Max (High, Heiken Ashi Open, Heiken Ashi Close)
Heiken Ashi Low = Min (Low, Heiken Ashi Open, Heiken Ashi Close)
The "better formula" modifies the standard Heiken Ashi calculation by incorporating additional smoothing, which can help reduce noise and make it easier to identify trends and reversals. The modified formulas for Heiken Ashi "better" candles are as follows:
Better Heiken Ashi Close = (Open + High + Low + Close) / 4
Better Heiken Ashi Open = (Previous Better Heiken Ashi Open + Previous Better Heiken Ashi Close) / 2
Better Heiken Ashi High = Max (High, Better Heiken Ashi Open, Better Heiken Ashi Close)
Better Heiken Ashi Low = Min (Low, Better Heiken Ashi Open, Better Heiken Ashi Close)
Smoothing Factor = 2 / (N + 1), where N is the chosen period for smoothing
Smoothed Better Heiken Ashi Open = (Better Heiken Ashi Open * Smoothing Factor) + (Previous Smoothed Better Heiken Ashi Open * (1 - Smoothing Factor))
Smoothed Better Heiken Ashi Close = (Better Heiken Ashi Close * Smoothing Factor) + (Previous Smoothed Better Heiken Ashi Close * (1 - Smoothing Factor))
The smoothed Better Heiken Ashi Open and Close values are then used to calculate the smoothed Better Heiken Ashi High and Low values, resulting in "better" candles that provide a clearer representation of the market trend and potential reversal points.
It's important to note that, like any other technical analysis tool, Heiken Ashi "better" candles are not foolproof and should be used in conjunction with other indicators and analysis techniques to make well-informed trading decisions.
Heiken Ashi "better" candles, as mentioned previously, provide a clearer representation of market trends and potential reversal points by reducing noise and smoothing out price data. When using these candles in conjunction with other technical analysis tools and indicators, traders can gain valuable insights into market behavior and make more informed decisions.
To effectively use Heiken Ashi "better" candles in your trading strategy, consider the following tips:
Trend Identification: Heiken Ashi "better" candles can help you identify the prevailing trend in the market. When the majority of the candles are green (or another color, depending on your chart settings) and there are no or few lower wicks, it may indicate a strong uptrend. Conversely, when the majority of the candles are red (or another color) and there are no or few upper wicks, it may signal a strong downtrend.
Trend Reversals: Look for potential trend reversals when a change in the color of the candles occurs, especially when accompanied by longer wicks. For example, if a green candle with a long lower wick is followed by a red candle, it could indicate a bearish reversal. Similarly, a red candle with a long upper wick followed by a green candle may suggest a bullish reversal.
Support and Resistance: You can use Heiken Ashi "better" candles to identify potential support and resistance levels. When the candles are consistently moving in one direction and then suddenly change color with longer wicks, it could indicate the presence of a support or resistance level.
Stop-Loss and Take-Profit: Using Heiken Ashi "better" candles can help you manage risk by determining optimal stop-loss and take-profit levels. For instance, you can place your stop-loss below the low of the most recent green candle in an uptrend or above the high of the most recent red candle in a downtrend.
Confirming Signals: Heiken Ashi "better" candles should be used in conjunction with other technical indicators, such as moving averages, oscillators, or chart patterns, to confirm signals and improve the accuracy of your analysis.
In this implementation, you have the choice of AMA, KAMA, or T3 smoothing. These are as follows:
Kaufman Adaptive Moving Average (KAMA)
The Kaufman Adaptive Moving Average (KAMA) is a type of adaptive moving average used in technical analysis to smooth out price fluctuations and identify trends. The KAMA adjusts its smoothing factor based on the market's volatility, making it more responsive in volatile markets and smoother in calm markets. The KAMA is calculated using three different efficiency ratios that determine the appropriate smoothing factor for the current market conditions. These ratios are based on the noise level of the market, the speed at which the market is moving, and the length of the moving average. The KAMA is a popular choice among traders who prefer to use adaptive indicators to identify trends and potential reversals.
Adaptive Moving Average
The Adaptive Moving Average (AMA) is a type of moving average that adjusts its sensitivity to price movements based on market conditions. It uses a ratio between the current price and the highest and lowest prices over a certain lookback period to determine its level of smoothing. The AMA can help reduce lag and increase responsiveness to changes in trend direction, making it useful for traders who want to follow trends while avoiding false signals. The AMA is calculated by multiplying a smoothing constant with the difference between the current price and the previous AMA value, then adding the result to the previous AMA value.
T3
The T3 moving average is a type of technical indicator used in financial analysis to identify trends in price movements. It is similar to the Exponential Moving Average (EMA) and the Double Exponential Moving Average (DEMA), but uses a different smoothing algorithm.
The T3 moving average is calculated using a series of exponential moving averages that are designed to filter out noise and smooth the data. The resulting smoothed data is then weighted with a non-linear function to produce a final output that is more responsive to changes in trend direction.
The T3 moving average can be customized by adjusting the length of the moving average, as well as the weighting function used to smooth the data. It is commonly used in conjunction with other technical indicators as part of a larger trading strategy.
█ Giga Kaleidoscope Modularized Trading System
Core components of an NNFX algorithmic trading strategy
The NNFX algorithm is built on the principles of trend, momentum, and volatility. There are six core components in the NNFX trading algorithm:
1. Volatility - price volatility; e.g., Average True Range, True Range Double, Close-to-Close, etc.
2. Baseline - a moving average to identify price trend
3. Confirmation 1 - a technical indicator used to identify trends
4. Confirmation 2 - a technical indicator used to identify trends
5. Continuation - a technical indicator used to identify trends
6. Volatility/Volume - a technical indicator used to identify volatility/volume breakouts/breakdown
7. Exit - a technical indicator used to determine when a trend is exhausted
What is Volatility in the NNFX trading system?
In the NNFX (No Nonsense Forex) trading system, ATR (Average True Range) is typically used to measure the volatility of an asset. It is used as a part of the system to help determine the appropriate stop loss and take profit levels for a trade. ATR is calculated by taking the average of the true range values over a specified period.
True range is calculated as the maximum of the following values:
-Current high minus the current low
-Absolute value of the current high minus the previous close
-Absolute value of the current low minus the previous close
ATR is a dynamic indicator that changes with changes in volatility. As volatility increases, the value of ATR increases, and as volatility decreases, the value of ATR decreases. By using ATR in NNFX system, traders can adjust their stop loss and take profit levels according to the volatility of the asset being traded. This helps to ensure that the trade is given enough room to move, while also minimizing potential losses.
Other types of volatility include True Range Double (TRD), Close-to-Close, and Garman-Klass
What is a Baseline indicator?
The baseline is essentially a moving average, and is used to determine the overall direction of the market.
The baseline in the NNFX system is used to filter out trades that are not in line with the long-term trend of the market. The baseline is plotted on the chart along with other indicators, such as the Moving Average (MA), the Relative Strength Index (RSI), and the Average True Range (ATR).
Trades are only taken when the price is in the same direction as the baseline. For example, if the baseline is sloping upwards, only long trades are taken, and if the baseline is sloping downwards, only short trades are taken. This approach helps to ensure that trades are in line with the overall trend of the market, and reduces the risk of entering trades that are likely to fail.
By using a baseline in the NNFX system, traders can have a clear reference point for determining the overall trend of the market, and can make more informed trading decisions. The baseline helps to filter out noise and false signals, and ensures that trades are taken in the direction of the long-term trend.
What is a Confirmation indicator?
Confirmation indicators are technical indicators that are used to confirm the signals generated by primary indicators. Primary indicators are the core indicators used in the NNFX system, such as the Average True Range (ATR), the Moving Average (MA), and the Relative Strength Index (RSI).
The purpose of the confirmation indicators is to reduce false signals and improve the accuracy of the trading system. They are designed to confirm the signals generated by the primary indicators by providing additional information about the strength and direction of the trend.
Some examples of confirmation indicators that may be used in the NNFX system include the Bollinger Bands, the MACD (Moving Average Convergence Divergence), and the MACD Oscillator. These indicators can provide information about the volatility, momentum, and trend strength of the market, and can be used to confirm the signals generated by the primary indicators.
In the NNFX system, confirmation indicators are used in combination with primary indicators and other filters to create a trading system that is robust and reliable. By using multiple indicators to confirm trading signals, the system aims to reduce the risk of false signals and improve the overall profitability of the trades.
What is a Continuation indicator?
In the NNFX (No Nonsense Forex) trading system, a continuation indicator is a technical indicator that is used to confirm a current trend and predict that the trend is likely to continue in the same direction. A continuation indicator is typically used in conjunction with other indicators in the system, such as a baseline indicator, to provide a comprehensive trading strategy.
What is a Volatility/Volume indicator?
Volume indicators, such as the On Balance Volume (OBV), the Chaikin Money Flow (CMF), or the Volume Price Trend (VPT), are used to measure the amount of buying and selling activity in a market. They are based on the trading volume of the market, and can provide information about the strength of the trend. In the NNFX system, volume indicators are used to confirm trading signals generated by the Moving Average and the Relative Strength Index. Volatility indicators include Average Direction Index, Waddah Attar, and Volatility Ratio. In the NNFX trading system, volatility is a proxy for volume and vice versa.
By using volume indicators as confirmation tools, the NNFX trading system aims to reduce the risk of false signals and improve the overall profitability of trades. These indicators can provide additional information about the market that is not captured by the primary indicators, and can help traders to make more informed trading decisions. In addition, volume indicators can be used to identify potential changes in market trends and to confirm the strength of price movements.
What is an Exit indicator?
The exit indicator is used in conjunction with other indicators in the system, such as the Moving Average (MA), the Relative Strength Index (RSI), and the Average True Range (ATR), to provide a comprehensive trading strategy.
The exit indicator in the NNFX system can be any technical indicator that is deemed effective at identifying optimal exit points. Examples of exit indicators that are commonly used include the Parabolic SAR, the Average Directional Index (ADX), and the Chandelier Exit.
The purpose of the exit indicator is to identify when a trend is likely to reverse or when the market conditions have changed, signaling the need to exit a trade. By using an exit indicator, traders can manage their risk and prevent significant losses.
In the NNFX system, the exit indicator is used in conjunction with a stop loss and a take profit order to maximize profits and minimize losses. The stop loss order is used to limit the amount of loss that can be incurred if the trade goes against the trader, while the take profit order is used to lock in profits when the trade is moving in the trader's favor.
Overall, the use of an exit indicator in the NNFX trading system is an important component of a comprehensive trading strategy. It allows traders to manage their risk effectively and improve the profitability of their trades by exiting at the right time.
How does Loxx's GKD (Giga Kaleidoscope Modularized Trading System) implement the NNFX algorithm outlined above?
Loxx's GKD v1.0 system has five types of modules (indicators/strategies). These modules are:
1. GKD-BT - Backtesting module (Volatility, Number 1 in the NNFX algorithm)
2. GKD-B - Baseline module (Baseline and Volatility/Volume, Numbers 1 and 2 in the NNFX algorithm)
3. GKD-C - Confirmation 1/2 and Continuation module (Confirmation 1/2 and Continuation, Numbers 3, 4, and 5 in the NNFX algorithm)
4. GKD-V - Volatility/Volume module (Confirmation 1/2, Number 6 in the NNFX algorithm)
5. GKD-E - Exit module (Exit, Number 7 in the NNFX algorithm)
(additional module types will added in future releases)
Each module interacts with every module by passing data between modules. Data is passed between each module as described below:
GKD-B => GKD-V => GKD-C(1) => GKD-C(2) => GKD-C(Continuation) => GKD-E => GKD-BT
That is, the Baseline indicator passes its data to Volatility/Volume. The Volatility/Volume indicator passes its values to the Confirmation 1 indicator. The Confirmation 1 indicator passes its values to the Confirmation 2 indicator. The Confirmation 2 indicator passes its values to the Continuation indicator. The Continuation indicator passes its values to the Exit indicator, and finally, the Exit indicator passes its values to the Backtest strategy.
This chaining of indicators requires that each module conform to Loxx's GKD protocol, therefore allowing for the testing of every possible combination of technical indicators that make up the six components of the NNFX algorithm.
What does the application of the GKD trading system look like?
Example trading system:
Backtest: Strategy with 1-3 take profits, trailing stop loss, multiple types of PnL volatility, and 2 backtesting styles
Baseline: Hull Moving Average
Volatility/Volume: Hurst Exponent
Confirmation 1: Time Fractal Energy Adaptive Laguerre RSI as shown on the chart above
Confirmation 2: Williams Percent Range
Continuation: Time Fractal Energy Adaptive Laguerre RSI
Exit: Rex Oscillator
Each GKD indicator is denoted with a module identifier of either: GKD-BT, GKD-B, GKD-C, GKD-V, or GKD-E. This allows traders to understand to which module each indicator belongs and where each indicator fits into the GKD protocol chain.
Giga Kaleidoscope Modularized Trading System Signals (based on the NNFX algorithm)
Standard Entry
1. GKD-C Confirmation 1 Signal
2. GKD-B Baseline agrees
3. Price is within a range of 0.2x Volatility and 1.0x Volatility of the Goldie Locks Mean
4. GKD-C Confirmation 2 agrees
5. GKD-V Volatility/Volume agrees
Baseline Entry
1. GKD-B Baseline signal
2. GKD-C Confirmation 1 agrees
3. Price is within a range of 0.2x Volatility and 1.0x Volatility of the Goldie Locks Mean
4. GKD-C Confirmation 2 agrees
5. GKD-V Volatility/Volume agrees
6. GKD-C Confirmation 1 signal was less than 7 candles prior
Volatility/Volume Entry
1. GKD-V Volatility/Volume signal
2. GKD-C Confirmation 1 agrees
3. Price is within a range of 0.2x Volatility and 1.0x Volatility of the Goldie Locks Mean
4. GKD-C Confirmation 2 agrees
5. GKD-B Baseline agrees
6. GKD-C Confirmation 1 signal was less than 7 candles prior
Continuation Entry
1. Standard Entry, Baseline Entry, or Pullback; entry triggered previously
2. GKD-B Baseline hasn't crossed since entry signal trigger
3. GKD-C Confirmation Continuation Indicator signals
4. GKD-C Confirmation 1 agrees
5. GKD-B Baseline agrees
6. GKD-C Confirmation 2 agrees
1-Candle Rule Standard Entry
1. GKD-C Confirmation 1 signal
2. GKD-B Baseline agrees
3. Price is within a range of 0.2x Volatility and 1.0x Volatility of the Goldie Locks Mean
Next Candle:
1. Price retraced (Long: close < close or Short: close > close )
2. GKD-B Baseline agrees
3. GKD-C Confirmation 1 agrees
4. GKD-C Confirmation 2 agrees
5. GKD-V Volatility/Volume agrees
1-Candle Rule Baseline Entry
1. GKD-B Baseline signal
2. GKD-C Confirmation 1 agrees
3. Price is within a range of 0.2x Volatility and 1.0x Volatility of the Goldie Locks Mean
4. GKD-C Confirmation 1 signal was less than 7 candles prior
Next Candle:
1. Price retraced (Long: close < close or Short: close > close )
2. GKD-B Baseline agrees
3. GKD-C Confirmation 1 agrees
4. GKD-C Confirmation 2 agrees
5. GKD-V Volatility/Volume Agrees
1-Candle Rule Volatility/Volume Entry
1. GKD-V Volatility/Volume signal
2. GKD-C Confirmation 1 agrees
3. Price is within a range of 0.2x Volatility and 1.0x Volatility of the Goldie Locks Mean
4. GKD-C Confirmation 1 signal was less than 7 candles prior
Next Candle:
1. Price retraced (Long: close < close or Short: close > close)
2. GKD-B Volatility/Volume agrees
3. GKD-C Confirmation 1 agrees
4. GKD-C Confirmation 2 agrees
5. GKD-B Baseline agrees
PullBack Entry
1. GKD-B Baseline signal
2. GKD-C Confirmation 1 agrees
3. Price is beyond 1.0x Volatility of Baseline
Next Candle:
1. Price is within a range of 0.2x Volatility and 1.0x Volatility of the Goldie Locks Mean
2. GKD-C Confirmation 1 agrees
3. GKD-C Confirmation 2 agrees
4. GKD-V Volatility/Volume Agrees
]█ Setting up the GKD
The GKD system involves chaining indicators together. These are the steps to set this up.
Use a GKD-C indicator alone on a chart
1. Inside the GKD-C indicator, change the "Confirmation Type" setting to "Solo Confirmation Simple"
Use a GKD-V indicator alone on a chart
**nothing, it's already useable on the chart without any settings changes
Use a GKD-B indicator alone on a chart
**nothing, it's already useable on the chart without any settings changes
Baseline (Baseline, Backtest)
1. Import the GKD-B Baseline into the GKD-BT Backtest: "Input into Volatility/Volume or Backtest (Baseline testing)"
2. Inside the GKD-BT Backtest, change the setting "Backtest Special" to "Baseline"
Volatility/Volume (Volatility/Volume, Backte st)
1. Inside the GKD-V indicator, change the "Testing Type" setting to "Solo"
2. Inside the GKD-V indicator, change the "Signal Type" setting to "Crossing" (neither traditional nor both can be backtested)
3. Import the GKD-V indicator into the GKD-BT Backtest: "Input into C1 or Backtest"
4. Inside the GKD-BT Backtest, change the setting "Backtest Special" to "Volatility/Volume"
5. Inside the GKD-BT Backtest, a) change the setting "Backtest Type" to "Trading" if using a directional GKD-V indicator; or, b) change the setting "Backtest Type" to "Full" if using a directional or non-directional GKD-V indicator (non-directional GKD-V can only test Longs and Shorts separately)
6. If "Backtest Type" is set to "Full": Inside the GKD-BT Backtest, change the setting "Backtest Side" to "Long" or "Short
7. If "Backtest Type" is set to "Full": To allow the system to open multiple orders at one time so you test all Longs or Shorts, open the GKD-BT Backtest, click the tab "Properties" and then insert a value of something like 10 orders into the "Pyramiding" settings. This will allow 10 orders to be opened at one time which should be enough to catch all possible Longs or Shorts.
Solo Confirmation Simple (Confirmation, Backtest)
1. Inside the GKD-C indicator, change the "Confirmation Type" setting to "Solo Confirmation Simple"
1. Import the GKD-C indicator into the GKD-BT Backtest: "Input into Backtest"
2. Inside the GKD-BT Backtest, change the setting "Backtest Special" to "Solo Confirmation Simple"
Solo Confirmation Complex without Exits (Baseline, Volatility/Volume, Confirmation, Backtest)
1. Inside the GKD-V indicator, change the "Testing Type" setting to "Chained"
2. Import the GKD-B Baseline into the GKD-V indicator: "Input into Volatility/Volume or Backtest (Baseline testing)"
3. Inside the GKD-C indicator, change the "Confirmation Type" setting to "Solo Confirmation Complex"
4. Import the GKD-V indicator into the GKD-C indicator: "Input into C1 or Backtest"
5. Inside the GKD-BT Backtest, change the setting "Backtest Special" to "GKD Full wo/ Exits"
6. Import the GKD-C into the GKD-BT Backtest: "Input into Exit or Backtest"
Solo Confirmation Complex with Exits (Baseline, Volatility/Volume, Confirmation, Exit, Backtest)
1. Inside the GKD-V indicator, change the "Testing Type" setting to "Chained"
2. Import the GKD-B Baseline into the GKD-V indicator: "Input into Volatility/Volume or Backtest (Baseline testing)"
3. Inside the GKD-C indicator, change the "Confirmation Type" setting to "Solo Confirmation Complex"
4. Import the GKD-V indicator into the GKD-C indicator: "Input into C1 or Backtest"
5. Import the GKD-C indicator into the GKD-E indicator: "Input into Exit"
6. Inside the GKD-BT Backtest, change the setting "Backtest Special" to "GKD Full w/ Exits"
7. Import the GKD-E into the GKD-BT Backtest: "Input into Backtest"
Full GKD without Exits (Baseline, Volatility/Volume, Confirmation 1, Confirmation 2, Continuation, Backtest)
1. Inside the GKD-V indicator, change the "Testing Type" setting to "Chained"
2. Import the GKD-B Baseline into the GKD-V indicator: "Input into Volatility/Volume or Backtest (Baseline testing)"
3. Inside the GKD-C 1 indicator, change the "Confirmation Type" setting to "Confirmation 1"
4. Import the GKD-V indicator into the GKD-C 1 indicator: "Input into C1 or Backtest"
5. Inside the GKD-C 2 indicator, change the "Confirmation Type" setting to "Confirmation 2"
6. Import the GKD-C 1 indicator into the GKD-C 2 indicator: "Input into C2"
7. Inside the GKD-C Continuation indicator, change the "Confirmation Type" setting to "Continuation"
8. Inside the GKD-BT Backtest, change the setting "Backtest Special" to "GKD Full wo/ Exits"
9. Import the GKD-E into the GKD-BT Backtest: "Input into Exit or Backtest"
Full GKD with Exits (Baseline, Volatility/Volume, Confirmation 1, Confirmation 2, Continuation, Exit, Backtest)
1. Inside the GKD-V indicator, change the "Testing Type" setting to "Chained"
2. Import the GKD-B Baseline into the GKD-V indicator: "Input into Volatility/Volume or Backtest (Baseline testing)"
3. Inside the GKD-C 1 indicator, change the "Confirmation Type" setting to "Confirmation 1"
4. Import the GKD-V indicator into the GKD-C 1 indicator: "Input into C1 or Backtest"
5. Inside the GKD-C 2 indicator, change the "Confirmation Type" setting to "Confirmation 2"
6. Import the GKD-C 1 indicator into the GKD-C 2 indicator: "Input into C2"
7. Inside the GKD-C Continuation indicator, change the "Confirmation Type" setting to "Continuation"
8. Import the GKD-C Continuation indicator into the GKD-E indicator: "Input into Exit"
9. Inside the GKD-BT Backtest, change the setting "Backtest Special" to "GKD Full w/ Exits"
10. Import the GKD-E into the GKD-BT Backtest: "Input into Backtest"
Baseline + Volatility/Volume (Baseline, Volatility/Volume, Backtest)
1. Inside the GKD-V indicator, change the "Testing Type" setting to "Baseline + Volatility/Volume"
2. Inside the GKD-V indicator, make sure the "Signal Type" setting is set to "Traditional"
3. Import the GKD-B Baseline into the GKD-V indicator: "Input into Volatility/Volume or Backtest (Baseline testing)"
4. Inside the GKD-BT Backtest, change the setting "Backtest Special" to "Baseline + Volatility/Volume"
5. Import the GKD-V into the GKD-BT Backtest: "Input into C1 or Backtest"
6. Inside the GKD-BT Backtest, change the setting "Backtest Type" to "Full". For this backtest, you must test Longs and Shorts separately
7. To allow the system to open multiple orders at one time so you can test all Longs or Shorts, open the GKD-BT Backtest, click the tab "Properties" and then insert a value of something like 10 orders into the "Pyramiding" settings. This will allow 10 orders to be opened at one time which should be enough to catch all possible Longs or Shorts.
Requirements
Inputs
Confirmation 1: GKD-V Volatility / Volume indicator
Confirmation 2: GKD-C Confirmation indicator
Continuation: GKD-C Confirmation indicator
Solo Confirmation Simple: GKD-B Baseline
Solo Confirmation Complex: GKD-V Volatility / Volume indicator
Solo Confirmation Super Complex: GKD-V Volatility / Volume indicator
Stacked 1: None
Stacked 2+: GKD-C, GKD-V, or GKD-B Stacked 1
Outputs
Confirmation 1: GKD-C Confirmation 2 indicator
Confirmation 2: GKD-C Continuation indicator
Continuation: GKD-E Exit indicator
Solo Confirmation Simple: GKD-BT Backtest
Solo Confirmation Complex: GKD-BT Backtest or GKD-E Exit indicator
Solo Confirmation Super Complex: GKD-C Continuation indicator
Stacked 1: GKD-C, GKD-V, or GKD-B Stacked 2+
Stacked 2+: GKD-C, GKD-V, or GKD-B Stacked 2+ or GKD-BT Backtest
Additional features will be added in future releases.
Double Supertrend Entry with ADX Filter and ATR Exits/EntriesThe Double Supertrend Entry with ADX Filter and ATR Exits/Entries indicator is a custom trading strategy designed to help traders identify potential buy and sell signals in trending markets. This indicator combines the strengths of multiple technical analysis tools, enhancing the effectiveness of the overall strategy.
Key features:
Two Supertrend Indicators - The indicator includes two Supertrend indicators with customizable parameters. These trend-following indicators calculate upper and lower trendlines based on the ATR and price. Buy signals are generated when the price crosses above both trendlines, and sell signals are generated when the price crosses below both trendlines.
ADX Filter - The Average Directional Index (ADX) is used to filter out weak trends and only generate buy/sell signals when the market exhibits a strong trend. The ADX measures the strength of the trend, and a customizable threshold level ensures that trades are only entered during strong trends.
ATR-based Exits and Entries - The indicator uses the Average True Range (ATR) to set profit target and stop-loss levels. ATR is a measure of market volatility, and these levels help traders determine when to exit a trade to secure profit or minimize loss.
Performance Statistics Table - A table is displayed on the chart, recording and showing the total number of winning trades, losing trades, percentage of profitable trades, average profit, and average loss. This information helps traders evaluate the performance of the strategy over time.
The Double Supertrend Entry with ADX Filter and ATR Exits/Entries indicator is a powerful trend-following strategy that can assist traders in making more informed decisions in the financial markets. By combining multiple technical analysis tools and providing performance statistics, this indicator helps traders improve their trading strategy and evaluate its success.

Moonhub IndexMoonhub Index combines several popular technical indicators to create an aggregated index that aims to give a clearer overall picture of the market. The index takes into account the current market condition (trending, ranging, or volatile) to adjust its calculations accordingly.
The indicators used in this composite index are:
Hull Moving Average (HMA)
Fisher Transform (FT)
Williams Alligator
Moving Average Convergence Divergence (MACD)
Average True Range (ATR)
On-Balance Volume (OBV)
Money Flow Index (MFI)
Accumulation/Distribution (AD)
Pivot Points
True Strength Index (TSI)
Volume-Weighted Average Price (VWAP)
The script calculates the values of each indicator and then normalizes and weighs them according to predefined weights. The composite index is formed by summing the weighted values of each indicator. The final Moon Index is plotted on the chart, along with several other related lines like the exponential moving averages (EMA) and simple moving averages (SMA) of the index.
This custom index can be used by traders to get a more comprehensive view of the market and make better-informed trading decisions based on the combined insights of multiple indicators.

[TTI] ATR Trailing Stop Alerts––––HISTORY & CREDITS 🏦
The Trailing Stop Alert is a TradingView indicator developed by TintinTrading, which is designed to help traders manage their positions by updating and alerting them about their trailing stop levels. This tool is a valuable addition to a trader's arsenal, as it automates the process of maintaining trailing stop levels and alerts the user when they are updated or hit.
––––WHAT IT DOES 💡
The Trailing Stop Alert indicator calculates trailing stop levels based on the Average True Range (ATR) of an asset over a specified lookback period. It takes user inputs for trail type (Long or Short), lookback period, ATR length, ATR multiplier, and bar time. The indicator can be applied to any financial instrument and will dynamically update the trailing stop level based on price action. When the trailing stop level is updated or hit, the indicator generates alerts to inform the user of these events.
––––HOW TO USE IT 🔧
1. Add the Trailing Stop Alert indicator to your TradingView chart.
2. Configure the settings according to your preferred parameters:
👉Trail Type: Choose between "Long" or "Short" based on your trading position.
👉Lookback: Set the number of bars to look back for determining the highest high or lowest low.
👉ATR Length: Set the period for calculating the Average True Range.
👉ATR Multiplier: Set the multiplier to adjust the trailing stop distance.
👉Bar Time: Set the time at which the indicator starts updating the trailing stop levels.
3. The indicator will plot the trailing stop level on the chart, and update it as the price action unfolds.
4. When the trailing stop level is updated or hit, you will receive an alert in the form of a message with the new level or a notification that the stop has been hit.
5. Adjust your stop loss orders accordingly based on the trailing stop levels provided by the indicator.
By using the Trailing Stop Alert indicator, you can effectively manage your positions and reduce the risk of giving back profits in a trade.

Scalper's toolkit - ATR WidgetWidget specifically designed for scalping. Many settings to fit the instrument and view preferences to make it fit into your chart window how you like, even on mobile.
** I have 5 other features to add into this in the very near future, as I use this as my primary tool for Risk reward. This script will be updated in the near future as more features are coded into it. See bottom for notes on plans
Features:
Displays a quick view of the ATR value on the chart, in decimal PIPs or directly in Points - a key value for scalping using the DOM for point value settings and one click trading on fast time frames.
Automatic calculation of stop and target distance for a predetermined Risk Reward Ratio (Set with the settings panel), and then also displayed in PIPs or Points for easy use in quick trading.
Works on most all instruments/pairs/cryptos with multiple precision levels for correct values to be shown in the widget.
Fully customizable -
ATR period Base setting, just like a normal ATR indicator
Display in : PIPs or Points
ATR based stop distance, using a multiplier. 2 is the most common multiplier used, and the default setting.
Risk Reward Calculation using the Stop Loss value.
-Quickly helps with proper target and stop sizing for the volatility in the price on the current trade entry point.
-Set to any ratio you wish, from 1:0.1 all the way to 1:100 or more, unlimited R ratio settings to fit your strategy and risk tolerances.
Position anywhere on the chart window with 9 preset locations available (Pine script limitation)
Show as a column layout or a row layout
Customize the Size, with 5 preset widget sizes, from tiny to huge (Pine script limitation)
-Mobile Friendly - Tiny or Small may be too small on PC, but can be used for Mobile so the widget does not become too large over the chart.
Custom text, background, and boarder colors
Custom Boarder Size - 0 size is no boarder
Set up:
-Open the settings panel.
First section is the basic settings for the ATR - the length (Default is 14) and to use a PIP value display, or Point value display.
Here you also see a "Precision" Setting. **Because each instrument returns different precision ATR values, it is difficult to determine with code what those values will be ahead of time to do the math in the background. Even some 2 decimal instruments return 5 decimal ATR values, so this setting filters that** Just use the dropdown and choose how many decimal places the instrument has from 2 - 5 decimals
The second section is for risk and reward calculations, and can be disabled if you do not want to see these values.
The first value is the "ATR Multiplier" Typically, a 2x multiplier is used on the ATR to determine how far away to place your stop loss from the entry, placing it out of harm's way from normal market activity.
The second value is the Reward target distance, based from the stop loss size. This quickly calculates your target to match your intended reward ratio, saving some manual work to calculate this by hand every trade.
** Note: because of the math used in the code, you may see odd values on some instruments, like indexes. If you have the precision correct, try changing the "Show in Pips" to "Show in Points", as this may solve the issue.
The last two sections are purely for how the widget looks and how/where it shows on the screen. These can be set however you like. To have no boarder, just set the "Frame size" value to 0.
Additional Updates planned:
Pip value calculation (2 feature uses)
-This will serve 2 purposes. The widget will calculate the value of the trade based on the lot size. It will also have a risk limit, so if the ATR get's too high for the current risk settings, It will show red to warn you of a high risk situation before you trade.
Example, you have a set limit of 3 dollars per trade using .02 lot sizing. If the ATR get's too high, The Stop value will be more risk than you would like to use at that trade sizing. Reduce the trade size, or wait for ATR to come lower.
Purpose 2: lot size calculation, so if you wanted to maximize the use of risk available. If you wanted to risk 600 for example, it would use the ATR you have set for the risk, and determine the proper lot size for the amount of volatility in the market. This way, you Risk Exactly, or as close as possible to 600 for the the current trade conditions.
Extra use for this value: Show the Current trade amounts at risk and for gain in money values on the side of the pip/point value. Know what you're risking and also trading for in monetary value.
ATR candle Comparison- Early momentum Detection (2 feature uses)
Will show an additional section on the bottom of the widget to show how each candle compares to the one before, up to the last 5, and show if ATR went down, up, or stayed the same over the last 5 candles.
Show an additional symbol to indicate the current candle status in comparison to the close of the last candle. Real time of if the ATR is getting larger, smaller, or staying the same.

Volatility Spike EstimatorPlots the Average True Range (ATR), its historical mean, the upper threshold for a volatility spike, and uses background color to show the likelihood of a volatility spike based on the current ATR value.
Green background indicates an increased likelihood of a volatility spike, while red background means a spike might have already occurred or be in progress.
Update: In this version, we added a short-term ATR calculation with an adjustable input parameter, shortTermATRLength. The likelihood of a volatility spike is now estimated based on the short-term ATR instead of the original ATR. This change makes the indicator more sensitive to recent market conditions and can help detect potential volatility spikes more quickly.

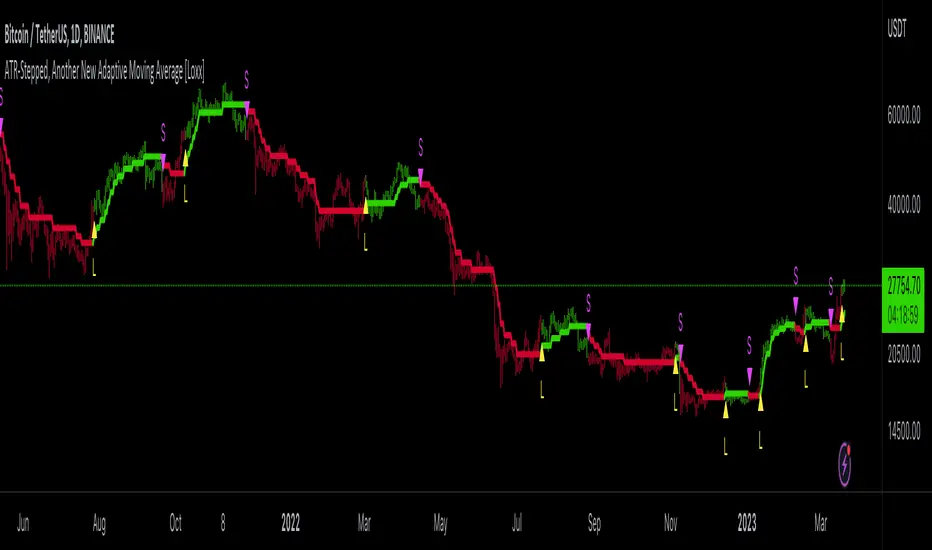
ATR-Stepped, Another New Adaptive Moving Average [Loxx]ATR-Filtered, Another New Adaptive Moving Average is a modification of @cheatcountry's "Another New Adaptive Moving Average " shown below
I've added AT- stepped filtering. This is a standard ATR filter that works by requiring movement by XX multiple of ATR before registering a trend flip. I've also included Loxx's Expanded Source Types. You can read about those here:
From @cheatcountry on A New Adaptive Moving Average
The New Adaptive Moving Average was created by Scott Cong (Stocks and Commodities Mar 2023) and this is a companion indicator to my previous script
This indicator still works off of the same concept as before with effort vs results but this indicator takes a slightly different approach and instead defines results as the absolute difference between the closing price and a closing price x bars ago. As you can see in my chart example, this indicator works great to stay with the current trend and provides either a stop loss or take profit target depending on which direction you are going in. As always, I use darker colors to show stronger signals and lighter colors to show normal signals. Buy when the line turns green and sell when it turns red.
Included
Alerts
Signals
Loxx's Expanded Source Types
Ladder ATRThis indicator shows the upwards (green) and downward (red) volatility of the market. It is a moving average of the true range values like the ATR indicator does but with a twist! For the upwards volatility, only the green candles are taken into account, and for the downwards only the red candles are.
To the best of my knowledge, this technique had been introduced by HeWhoMustNotBeNamed in his "Supertrend - Ladder ATR" publication where the different types of volatility helped to improve the "trend reversal" conditions compared to the "Supertrend" indicator.
However, the actual "Ladder ATR" values were hard to see. This indicator shows the actual upward and downward volatility making it easy to reason about long and short price moves and potential biases in each direction.
In layman's terms this indicator "Ladder ATR" is to the "Supertrend - Ladder ATR" what the "Average True Range" indicator is to the "Supertrend" indicator.

Typical Sweeps: Pivot high/low boxes. Grade sweeps, Handles/PipsTool to show typical pip-grade/ handle-grade sweep distance above pivot highs and pivot lows
-In consolidation/ranging periods (i.e. most of the time); Highs/Lows may by swept by fairly consistent distances in typical stop raids.
-Idea is from ICT teaching on typical Pip-grade sweeps in FX (10,20,30pips). Designed to work on FX, Indices, Commodities, Bitcoin.
-Above chart shows S&P; sweeping below and then above by 5 handles.
///inputs///
~choose sweep distance handles ($) or pips: will auto-calculate depending on the asset: FX= pips; Indices/stocks/commodities = handles ($)
--(2,5,10,20,30,50,100, 500, 1000)
~choose pivot lookback: larger number for more significant swing highs/lows
~choose number of historical boxes to display
~toggle on/off Pivot high boxes and Pivot low boxes independently
~extend boxes fully to the right (default is not extend)
~toggle on/off text
~text & box formatting options
Bitcoin, hourly chart; Pivot lookback = 15; $100 sweep boxes:
Eur/Usd; 15m chart; Pivot lookback = 30; 10pip sweep boxes; Boxes extended fully to the right:

+ Average Candle Bodies RangeACBR, or, Average Candle Bodies Range is a volatility and momentum indicator designed to indicate periods of increasing volatility and/or momentum. The genesis of the idea formed from my pondering what a trend trader is really looking for in terms of a volatility indicator. Most indicators I've come across haven't, in my opinion, done a satisfactory job of highlighting this. I kept thinking about the ATR (I use it for stops and targets) but I realized I didn't care about highs or lows in regards to a candle's volatility or momentum, nor do I care about their relation to a previous close. What really matters to me is candle body expansion. That is all. So, I created this.
ACBR is extremely simple at its heart. I made it more complicated of course, because why would I want anything for myself to be simple? Originally it was envisaged to be a simple volatility indicator highlighting areas of increasing and decreasing volatility. Then I decided some folks might want an indicator that could show this in a directional manner, i.e., an oscillator, so I spent some more hours tackling that
To start, the original version of the indicator simply subtracts opening price from closing price if the candle closes above the open, and subtracts the close from the open if the candle closes below the open. This way we get a positive number that simply measures candle expansion. We then apply a moving average to these values in order to smooth them (if you want). To get an oscillator we always subtract the close from the open, thus when a candle closes below its open we get a negative number.
I've naturally added an optional signal line as a helpful way of gauging volatility because obviously the values themselves may not tell you much. But I've also added something that I call a baseline. You can use this in a few ways, but first let me explain the two options for how the baseline can be calculated. And what do I mean by 'baseline?' I think of it as an area of the indicator where if the ACBR is below you will not want to enter into any trades, and if the ACBR is above then you are free to enter trades based on your system (or you might want to enter in areas of low volatility if your system calls for that). Waddah Attar Explosion is another indicator that implements something similar. The baseline is calculated in two different ways: one of which is making a Donchian Channel of the ACBR, and then using the basis as the baseline, while the other is applying an RMA to the cb_dif, which is the base unit that makes up the ACBR. Now, the basis of a Donchian Channel typically is the average of the highs and the lows. If we did that here we would have a baseline much too high (but maybe not...), however, I've made the divisor user adjustable. In this way you can adjust the height (or I guess you might say 'width' if it's an oscillator) however you like, thus making the indicator more or less sensitive. In the case of using the ACBR as the baseline we apply a multiplier to the values in order to adjust the height. Apologies if I'm being overly verbose. If you want to skip all of this I have tooltips in the settings for all of the inputs that I think need an explanation.
When using the indicator as an oscillator there are baselines above and below the zero line. One funny thing: if using the ACBR as calculation type for the baselines in oscillator mode, the baselines themselves will oscillate around the zero line. There is no way to fix this due to the calculation. That isn't necessarily bad (based on my eyeball test), but I probably wouldn't use it in such a way. But experiment! They could actually be a very fine entry or confirmation indicator. And while I'm on the topic of confirmation indicators, using this indicator as an oscillator naturally makes it a confirmation indicator. It just happens to have a volatility measurement baked into it. It may also be used as an exit and continuation indicator. And speaking of these things, there are optional shapes for indicating when you might want to exit or take a continuation trade. I've added alerts for these things too.
Lastly, oscillator mode is good for identifying divergences.
Above we have the indicator set to directional, or oscillator, mode. Baselines are Donchian Channels. I changed the default EMA length from 4 to 24 in this case, otherwise all the settings are default, as in the main image for the indicator (which is clearly set to non-directional). The indicator is set to requiring an advancing signal line for background and bar colors. Background color is not on by default. Candle colors, as you can see are aqua when above the top baseline (and only when the signal line is advancing, as per the settings), magenta when below the bottom baseline, and grey for anything else. The red and blue X's are exit signals. There are two types: one, when the signal line weakens and, two, when the ACBR crosses above or below the signal line. There are also arrows. These are continuation signals (ACBR crossing signal line).
Same image as above, but the baselines are set to ACBR rather than Donchian Channels.
Again, the same image, but with everything but the ACBR Baseline turned off. You can see how this might make for an excellent confirmation indicator, but for the areas of chap. Maybe run a second instance of the indicator on your chart as a volatility indicator, as you would not be using it in that way in this instance.
Here I have bar coloring turned off except for signal line crosses NOT requiring the signal line to be advancing. Background coloring is also turned on. You can see that these all line up with continuation signals, or exits for purple candles.
Same image as above but requiring the signal line to be advancing. You can see that continuation signals are not contingent upon the signal line to be advancing. I had it setup that way at first, but of course it still gave false signals, so I thought more signals (not that there are many) is better than fewer. To be sure, just because the indicator shows a continuation signal does not mean you should always take it.
Rail Line Levels [s3]Plots support/resistance lines based on a neutral signal (white portion) of the Rail Line (variable moving average) for a period of time designated by the user (defaults to 9 bars). Support/Resistance lines will be removed after a period of tests and can be determined by the user (defaults to 26). Support/Resistance is deemed not as important or strong after several touches or tests. The trailer uses a combination of the calculation for the Rail Line (variable moving average) and an ATR to show the overall trend direction.
The indicator is centered around a Variable Moving Average. The Variable Moving Average (VMA) is a study that uses an Exponential Moving Average being able to automatically adjust its smoothing factor according to the market volatility.
In addition to the VMA, the indicator makes use of the ATR which measures market volatility by decomposing the entire range of an asset price for that period. The true range is taken as the greatest of the following: current high less the current low; the absolute value of the current high less the previous close; and the absolute value of the current low less the previous close.

TheATR™: Volatility Extremes (VolEx)Volatility is a crucial aspect of financial markets that is closely monitored by traders and investors alike. The traditional Average True Range (ATR) oscillator is a widely used technical indicator for measuring volatility in financial markets. However, there are limitations to the ATR oscillator, as it does not account for changing market conditions and may not adequately reflect extreme price movements. To address these limitations, TheATR has developed the VolEx indicator, which aims to identify extremes in the ATR oscillator by building dynamic thresholds using either a 'percentage' or 'standard deviation' based comparison with the value of the ATR.
The VolEx indicator utilizes a dynamic approach to measure volatility by considering the current level of the ATR oscillator relative to the dynamically generated thresholds. The dynamic thresholds are calculated based on the current ATR value and the chosen method of comparison (either 'percentage' or 'standard deviation'). If the ATR value exceeds the upper dynamic threshold, the market is experiencing high volatility, while a value below the lower dynamic threshold indicates low volatility.
The VolEx indicator offers several advantages over traditional volatility indicators, such as the ATR oscillator. First, it takes into account the changing market conditions and adjusts the thresholds accordingly. Second, it offers flexibility in the choice of the comparison method, allowing traders to tailor the indicator to their specific trading strategies. Finally, it provides clear signals for identifying extremes in volatility, which can be used to inform trading decisions.
In summary, the VolEx indicator developed by TheATR is a dynamic and flexible technical indicator that offers a robust approach to measuring volatility in financial markets. By utilizing dynamic thresholds and allowing for different comparison methods, the VolEx indicator provides a valuable tool for traders and investors seeking to identify extremes in market volatility..
NOTE: It is important to note that volatility, as measured by the VolEx indicator, does not provide any directional bias for the market movement. Rather, it simply indicates the degree to which the market is moving, regardless of direction. Traders and investors must use other technical or fundamental analysis tools to determine the direction of the market and make informed trading decisions based on their individual strategies and risk tolerance.

Artharjan - ATR DashboardArtharjan - ATR Dashboard indicator is designed to plot a dashboard of Average True Range for past 10 candles on the chart. It calculates and shows what percentage of the closing price the ATR is for the selected timeframe.
It also plots the volume of past 10 days and shows whether the volume has gone up (Green Color) or fallen (Red Color)
For daily timeframe since there are 22 active trading days per month a default 11 period is selected for the Daily timeframe however users may change according to their preference.
If the timeframe is in seconds - 75 period is used to calculate ATR
If the timeframe is in Intraday - 25 period is used to calculate ATR
If the timeframe is in Daily - 11 period is used to calculate ATR
If the timeframe is in Weekly - 4 period is used to calculate ATR
If the timeframe is in Monthly - 3 period is used to calculate ATR
The Default ATR period is 14. User has a choice to select the ATR period based on the timeframe or use Standard 14 period for all timeframes.
There is also a provision created to add a Buffer % to the ATR that is calculated. With this Buffer the Options Selling Prices (For Short Strangle Strategy) are calculated. If the Buffer is set to 0 then no Buffer is added to the ATR.
Strike Switch is provided to change the way the Call and Put Options Strike Prices are calculated.
There are two options provided to calculate short strike prices for Out of Money Call and Out of Money Put.
1] Strikes calculation based on H/L of previous candle
2] Strikes calculation based on the midpoint of previous candle (High + Low) /2
Short strikes for the OTM Call Option and OTM Put Options are calculated by adding the Buffered ATR either to the Previous Day High and subtracting Buffered ATR from Previous Day Low OR by adding the Buffered ATR either to the mid point of Previous Day and subtracting Buffered ATR from mid point of previous Day. If Buffer % is set to zero then no Buffer is added to the ATR.
Traders can decide whether they wish to enter the trade if the ATR is let's say at least 1.25% or higher of the Candles closing price that will ensure decent options premium to be collected by Options Writers.
The Dashboard plots following details for 10 period
1] Closing Price (LTP)
2] % Change of Closing Price
3] ATR for the selected Period
4] % Change in ATR
5] ATR as a Percentage of LTP
6] Buffered ATR
7] CE Strike
8] PE Strike
9] Volume (IN THOUSANDS)
Hope traders will find this dashboard very useful.
Regards
Rahul Desai
@Artharjan

ATR/ADR coveredThis indicator is used to gauge the current price movement of the instrument relative to its Daily ATR and Daily ADR%.
The indicator has 4 parameters on its panel.
ADR% - This shows the average daily price range for the past given period.
ATR - This shows the average true range of the past given period.
Atr covered - Expressed in %, this shows how much of the ATR, the price has covered today.
Adr covered - Expressed in %, this shows how much of the ADR%, the price has covered today.
This indicator can be used to gauge how far the intraday price has moved from its ADR% and ATR and hence decide whether the stock is extended or not.
Note: The Indicator only shows values based on Daily timeframe.
-ve value of Atr covered is relative to the price direction of the instrument in comparison to yesterday.

Stock Data Table█ OVERVIEW
This is a table that shows some information about stocks. It is divided into four sections:
1) Correlation
2) Shares
3) Daily Data
4) Extended Session Data
The table is completely modular, which means you can add or remove each element from the settings menu, and it will automatically rearrange its spaces.
It is also highly customizable, to the extent that you can change almost any color, remove or change titles, invert section rows, and much more.
1) Correlation
The script checks if the stock is listed on NASDAQ, and if so, uses the QQQ (Nasdaq-100 ETF) as the reference index in the first cell; otherwise, it uses the SPY (S&P 500 ETF). The length of the correlation is shown in the second cell. The table then displays the correlation between the reference index and the other index, and the correlation between the reference index and the stock.
To make it easier to interpret the correlation values, each row's last cell is color-coded with a gradient to highlight the type of correlation, and the direction of the gradient can be customized.
The correlation coefficient is a statistical measure that quantifies the strength and direction of the relationship between two variables, indicating how changes in one variable are associated with changes in the other variable, so it can be used to identify patterns and trends.
If you are interested in correlation, I suggest taking a look at my dedicated indicator:
2) Shares
This feature provides you with quick access to key information about shares and market capitalization.
On one row, you can view the total shares outstanding and the market capitalization for the fiscal year or the quarterly year. The total shares outstanding represents the total number of shares of the stock that have been issued and are currently outstanding, regardless of whether they are held by insiders or public investors. The market capitalization is a widely used measure of the company's value as determined by the stock market, calculated by multiplying its current stock price with the total number of outstanding shares.
The other row shows the float, which is the number of shares of a company that are available for public trading, and the corresponding free-float market cap, calculated by multiplying the company's current stock price with the float. Because Pine Script does not allow retrieving information about quarterly year float, you can view the float and the free-float market cap of the fiscal year only. The data can be displayed at all times or only when the difference between the total shares outstanding and the float is significant enough to result in a difference between the market cap and free-float market cap.
The classification for market cap and free-float market cap is set in this way:
Mega Cap: $200 billion or more
Large Cap: between $10 billion and $200 billion
Mid Cap: between $2 billion and $10 billion
Small Cap: between $300 million and $2 billion
Micro Cap: less than $300 million
Penny Stocks: less than $5 (customizable)
Comparing the free-float market cap to the market cap can provide insights into the liquidity of a stock. In fact, if the float is relatively small compared to the total shares outstanding, it may be more difficult to find buyers or sellers, which could lead to increased volatility. On the other hand, a larger float indicates that the stock is more liquid and may be easier to trade, potentially resulting in lower volatility. However, market conditions can change quickly and significantly, especially for intraday traders, and the free-float can also change as insiders or other large shareholders buy or sell shares. Therefore, comparing the data of the fiscal year with that of the quarterly year may not provide the most up-to-date and accurate information for making trading decisions. This limitation can be mitigated by combining those data with other indicators and tools, such as technical analysis or news events, to gain a better understand of the stock's performance and potential trading opportunities.
3) Daily Data
This section is available on daily charts only due to the lack of accuracy of real-time daily data on other time frames. Here, you can view the Average Daily Volume (ADV) over a preferred time range (20 days by default), and the Daily Change, which represents the percentage difference between the closing price on two consecutive trading days.
ADV is useful in measuring the stock's volatility, as it provides an indication of how much trading activity there is in it. Generally speaking, stocks with higher trading volume tend to be less volatile than stocks with lower trading volume. High trading volume means there are more buyers and sellers actively trading the stock, which makes it easier for investors to buy and sell shares at fair prices. This increased liquidity can help to stabilize the stock price, reducing the potential for large swings in either direction. On the other hand, stocks with lower trading volume may experience greater volatility, as there are fewer buyers and sellers actively trading the stock. This can result in larger price swings, as it may be more difficult for investors to buy or sell shares at fair prices.
The daily percentage change can provide an indication of the stock's volatility, with larger values indicating greater volatility and risk. It can also be compared to that of a benchmark such an index or other stocks in the same sector, helping to determine whether the stock is outperforming or underperforming relative to them.
4) Extended Session Data
The fourth section is available on intraday charts only. This section provides two pieces of information: the Extended Session Change and the Pre-Market Volume.
The Extended Session Change indicates the percentage difference between the previous day's closing price and the latest price in the extended session. This gives you the extent and the direction of the price gap that occurred during extended trading hours.
The Pre-Market Volume shows the sum of all shares traded during the pre-market session. This can be helpful in understanding how much interest the stock gained before the market opened.
By default, the two rows will be visible at all times. They will stop updating after the end of their respective time range, and resume updating when it starts again. However, you can choose to automatically hide them outside of their time ranges.
Both the extended session and pre-market time ranges can be customized. Please note that if you select time ranges outside of the regular market session (as set by default), you must enable the extended session to view the corresponding rows.
█ GENERAL NOTES
• Total Shares Outstanding, Float, Average Daily Volume and Pre-Market Volume cells use a customizable color system based on two thresholds, to help you quickly identify whether the value is "too low/acceptable/too high" or "too low/not enough high/acceptable".
• If you cannot see certain data, that simply means it is not available.
