RSMI have published that script not like oscillator, which in fact it is, because tradingview doesn't support dual plots in overlay=true and overlay=false. So I have decided that to show filter is better idea. Yes, it decrease potential profit on long term, but for me personally, it is much better to understand the direction of the market movement and take potential trades more seriously. Also about this script: in general based on RSI and works pretty nice on 1H timeframe. Yes, theoretically it can work on both 4H and 1D timeframes, but for this you need to change the settings that are not displayed in the inputs (I did not add them, due to the fact that they can be confusing, because I decided to add a filter). And about filter - it is one of the variations of the SuperTrend. According to House Rules, I cannot insert links here, but only if you are interested in trying this work in auto trading, you can follow the link (located even lower) and find there an algorithm with the same name.
Automatedtrading

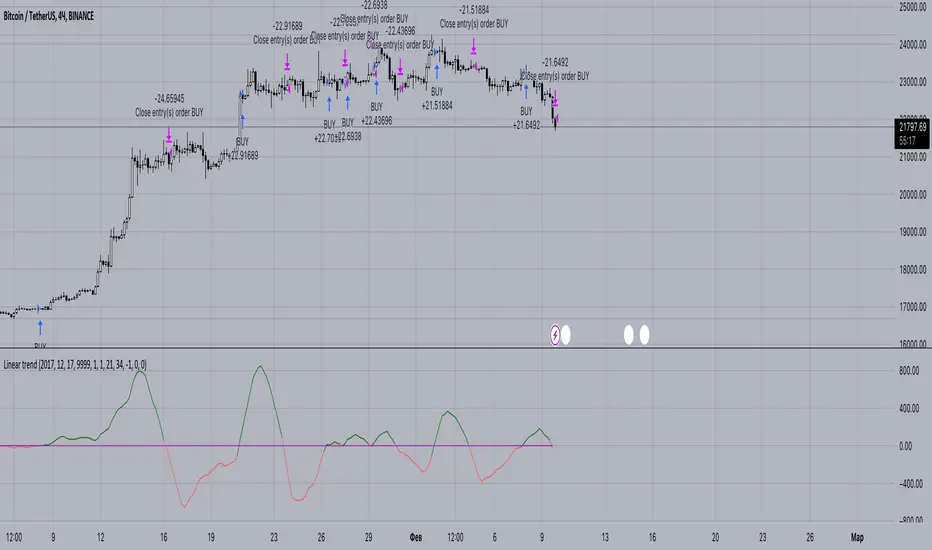
Linear trendThis oscillator based on linear regression . By subtracting the slower LMA from the faster LMA we can get a value, which we will further compare with zero. If the resulting difference is greater than 0, then we can assume that the trend is upward. Also by using offset we could increase the expected profit (focusing on backtest data).
You could get access for this script by the link below.
hamster-bot PDD Pump and Dump DetectorPump and Dump detector by hamster-bot
strategy author: foresterufa
Pump and Dump detector (PDD)
This is a trend strategy, with a unique mechanism of multi-stage re-entry into a position (Take Profit-Entry) when a significant trend develops, based on our HiDeep indicator.
Positions are opened by the HiDeep indicator signal with trend direction filtering and volatility filtering. Positions are closed by a HiDeep indicator signal or a change in the trend direction.
The position can be accompanied by a unique Stoploss trailing MA.

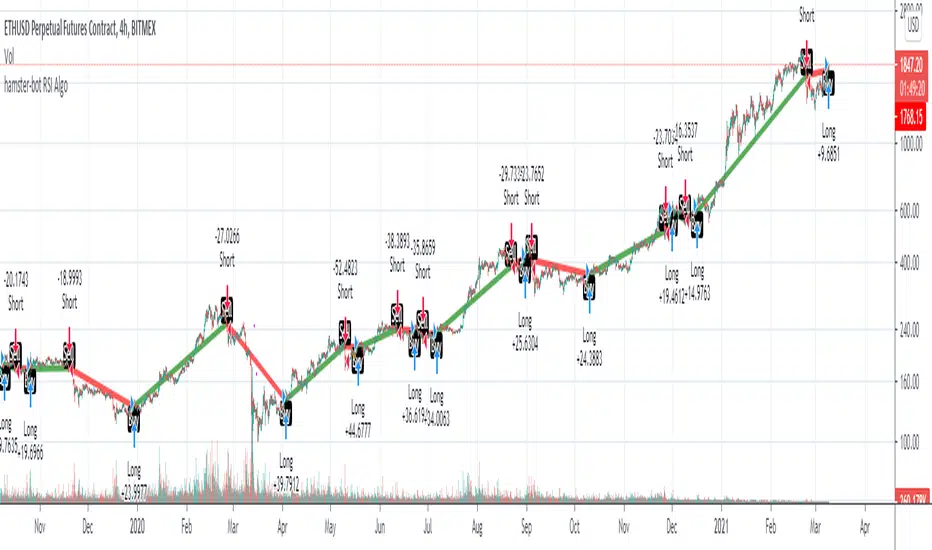
hamster-bot RSI AlgoThis is a simple RSI based signal indicator. It is designed for algorithmic bot trading.
For best results, leave a time-frame of at least 1 hour.
When the RSI reaches 70, it gives a buy signal, and when the RSI reaches 30, it gives a sell signal. The position is then maintained until the opposite signal is given. If backtesting shows poor results, but looks like the opposite would be good, there is a simple switch in the settings to turn it over.
original indicator on the basis of which the strategy is made:
Heikin Ashi+RSI+EMA Strategy 2.0 v4 [Cryptocurrency] by GodtrixHi,
I know a lot of people are looking for a more sophisticated and customizable strategy tool, I'm facing the same problem too, so I created one for myself and decided to share it for free trials and if you think this tool do what you wanted, you can contact me for the subscription "Premium" version.
I'll keep it simple with point forms, if you have any further inquiries or questions, please feel free to message me. Thank you.
Best profit plan with this strategy is you trade on Future leverage while you hold on to your coin, so that when price goes up, your coin value goes up, and at the same time, you trade with your leverage to earn even more, easily doubling up your total profit.
Benefits:
Fully customizable and you can easily personalized it and FINE TUNE it according to the market or coin you trading on.
The strategy is based on REAL PRACTICAL trading skills, so it works in real-world.
I fixed the "repainting" issue so the backtest it shows you IS ACCURATE when you run for real-time.
We all know one indicator is not going to help you win your trades, so this strategy combines ALL three: EMA for long+short term trend, HA for short term trend, RSI for entry/exit
This strategy is designed for LONG trade (Buy low, Sell high), not for SHORT trade.
This is not day trading, it is more to mid-term trading, where there's only few trades per month
Mainly is coded to work with 3Commas bot auto trading, so you only need to key in your Bot ID & Email Token.
Bot trading NOTE:
You need to replace the Alert Message with this: {{strategy.order.alert_message}}
One Alert will work for both Buy and Sell Order
If you using other Bot service, you can enter Custom Command too, so it works on any bot service.
Lastly,
regarding the setting advice, I would say you try playing with different settings and your objective is to achieve a backtest result that has:
1) Profitable is > 80%
2) Losing trades is nearly 0 or below 25% of your winning trades. Trick is using far stop loss %
3) Net Profit be almost same or more than "Buy & Hold Profit"
If you interested in our subscription version, message me for price.
Best Luck & a million dollar profit to you,
Godtrix BITSTAMP:BTCUSD BINANCE:DOTUSDT

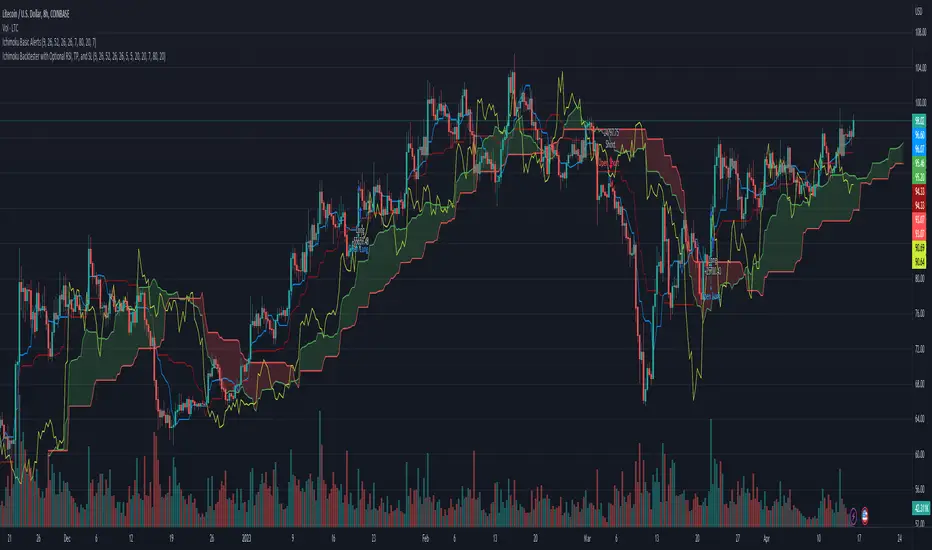
Ichimoku Backtester with TP, SL, and Cloud Confirmation OptionStarted with the Basic Ichimoku strategy from Mizuki32. Added Take Profit, Stop Loss (for both long and short), and a toggle to wait for confirmation from the cloud.
hamster-bot HD preset_2presets for users
// DESCRIPTION OF STRATEGY ver. 2
HiDeep Strategy
Author foresterufa
This is a counter-trend strategy that is gradually gaining a position against the trend at the best price.
A prerequisite for completing a position is the price exit from the internal channel on the chart and the appearance of the HiDeep indicator.
The condition for closing the position is touching the opposite side of the internal channel.
A condition for facilitating closure along the middle line of the channel, with high price volatility , is that the price touches the border of the external channel.
Input signals are generated by HiDeep indicators. Closing a position by moving averages.

Noro's ZZ-6 by hamster-botThe original script is available here
New version of ZZ-strategy.
Repaint?
Normal lines are not redrawn. Dotted lines repaint, but do not affect trading (do not affect backtests). You can turn off repaint in the script settings. Repaint (dotted lines) are needed only for clarity. To make it clear from which bar the level is created.
Levels
Lime lines above - level from a local high bar. To open a long position. Using a market stop order.
Red line at the bottom - the level from a local low bar. To open a short position. Using a market stop order.
Trading
You can trade without short positions. Then the red line is the level for a stop-loss order.
Reverse trading can be used. Without stop-loss orders.
Risk size
Order size depends on the risk size parameter and possible loss. If risk size = 2%, it means that the loss will be no more than 2%.
For crypto
Symbols: XBT/USD, BTC /USD, BTC /USDT, ETH/USD, etc - need USD(T)
Timeframes: 1h, 4h, 1d
The script will continue to be developed by the Hamster Bot team

Bitlinc MARSI Study AST w/ Take Profit & Stop loss - beta 0.1This script is beta 0.1 - will update as soon as the script is tradable
This script is based on AST on a 10 minute timeframe. You can change the asset and the timeframe for any asset you want to trade, but for it to work correct ALL settings have to be testes in the Strategy section of the TradingView. Each assets and timeframe require a different mixture of settings. This is NOT a one settings fits all trading for all assets on any timeframe. Below are the settings and explanation on how it works.
How it fires a buy / sell:
The script will plot an RSI with upper and lower bands in a separate indicator window. The idea behind this script is to fire a LONG when MA crosses OVER lower band and fire a SHORT when the MA crosses under the lower band. Each order that fires is an OCO (Order Cancels Order) for pyramiding.
Settings:
You have full control of these settings as mentioned above, you must configure every part of this script for each asset and timeframe you trade.
- Length of MA
- Length
- Upper bands of RSI
- Lower bands of RSI
- Take profit percentage
- Stop loss percentage
- Month to start and end the strategy (within 2020)
- Day to start and end the strategy (within 2020)
- Quantity type
- Slippage
- Pyramiding
***Remember that after the signal to enter or exit a trade is fired, the alert will trigger AFTER the close of the candle that caused the tigger to fire

Trading Safely Market Crusher Pro Strategy BuilderWith The Market Crusher Pro You Can Build Trading Strategies For Options, Futures, Cryptocurrencies, Equities, Commodities, Currencies, and Stock Market Indexes.
The Market Crusher Pro Buy And Sell Strategy Builder gives you the ability to back-test all tradeable markets. You can back test using specific trading times on any chart time frame before you execute any trades for both manual trading and automated trading.
The Market Crusher Pro Buy & Sell signals are determined utilizing our price range volatility algorithmic technical indicator designed to generate alpha.
The Market Crusher Pro Buy & Sell signals will only be visible during your specified trading times.
The Market Crusher Pro Profit Targets are determined in percentages and you can take profit up to 4 times per trade.
I suggest setting limit orders at profit targets.
To determine how much of position to close divide position size by number of profit targets
Example: If your position size is 100k and you are in a Long trade set 4 limit sell orders of 25k each at your 4 profit targets.
*Percentage of position to be closed for each trade is set to 25% however, you can adjust this to take profit 3 times by changing settings on 1st, 2nd, and 3rd profit targets to 33.3%, or 2 times by changing 1st and 2nd profit targets to 50%
Highlights:
Add to any ticker, and time frame
Specify trading times
Specify both long and short profit targets in percentages
Take profit up to 4 times per trade
Use either a fixed stop loss or a trailing stop loss or both
Set Strategy alerts
Prints on the current bar in real time
DOES NOT repaint several bars after the fact
*We only use candles for trading and back testing because, Heikin Ashi, Renko, Kagi, Point & Figure, and Range produce unrealistic results.
*Back test results below are based on a initial capital of $5000 and Trade using 10% of initial capital.
Please Note: For forex trading to enter a trade on EURUSD for example the spread is typically 1.2-2.0 pips to enter a trade so you are not charged a commission on every market buy or sell or for limit orders set at profit targets. We are not able to input this into back test settings.
Example: If you open a 100k position it will cost you $12-$20 assuming the spread is 1.2 to 2.0 pips
Please Note: All users get access to weekly trading and strategy building sessions and a interactive Q&A. You can get more information on these benefits as well as get access to the strategy builder by clicking the MC PRO link listed in signature section below

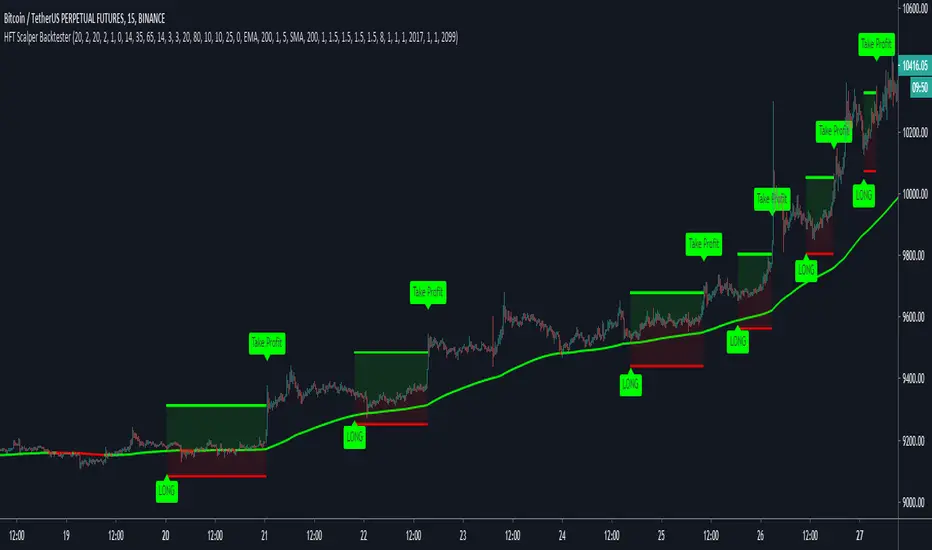
HFT Fibonacci Bands BacktesterDefault Settings are meant to be used in XBT/USD chart on 15 min time frame. If you want to use for another asset on another time frame YOU MUST CHANGE THE SETTINGS
This is a Fibonacci bands based trading strategy developed by HFT Research. It is a highly customizable strategy and provides endless opportunities to find profitable trades in the market.
Use Fib BB
This is the main decision maker of the strategy. Tuning the settings of this portion of the strategy will change the outcome the most. We have provided default settings. However, they are only good for 15min chart on Bitcoin . Please adjust accordingly.
Fib BB Length: This setting adjusts the middle line of your Fibonacci Bands. It is the moving average that you take it as base for your Fibonacci bands. Default value is currently 20.
Fib Level to Use for Entry: Here, you adjust which one of the Fibonacci Ratio levels you would like to use for your entry. You can only choose one of the following options.
Fibonacci Ratio 1
This is your Fib ratio level 1 and you can put any number here you would like
Fibonacci Ratio 2
This is your Fib ratio level 2 and you can put any number here you would like
Fibonacci Ratio 3
This is your Fib ratio level 3 and you can put any number here you would like
Please keep in mind that Ratio 1 should be higher than Ratio 2 and Ratio 2 should be higher than Ratio 3.
Use RSI
You can also turn on and off the RSI as well. Alternatively, there is an option to use RSI on a different time frame than you are currently on. For example, if you are looking at the 5min chart to use Bollinger bands but you would like to look at the RSI value on the 15min chart. You can do so by selecting the custom RSI timeframe as well as adjusting the Oversold and Overbought value.
Use CCI
Commodity Channel Index is an indicator developed by Donald Lambert. It is a momentum-based oscillator used to help determine when an investment vehicle is reaching conditions of being overbought or oversold. It also used to asses price trend direction and strength. Default settings are usually the safest and the best fit.
Use VWAP
VWAP stands for volume weighted average price . It is an extremely useful indicator when trading intra-day. It does reset every trading session which is at 00:00 UTC . Instead of looking at x number of candles and providing an average price, it will take into consideration volume that’s traded at a certain price and weigh it accordingly.
Use ADX
ADX stands for average directional index . It is an indicator that measures volatility in the market. Unfortunately, the worst market condition for this strategy is sideways market. ADX becomes a useful tool since it can detect trend. If the volatility is low and there is no real price movement, ADX will pick that up and will not let you get in trades during a sideways market. It will allow you to enter trades only when the market is trending.
Use MA Filters
Lookback: It is an option to look back x number of candles to validate the price crossing. If the market is choppy and the price keeps crossing up and down the moving average you have chosen, it will generate a lot of “noisy” signals. This option allows you to confirm the cross by selecting how many candles the price needs to stay above or below the moving average. Setting it 0 will turn it off.
MA Filter Type: There is a selection of moving averages that is available on TradingView currently. You can choose from 14 different moving average types to detect the trend as accurate as possible.
Filter Length: You can select the length of your moving average. Most commonly used length being 50,100 and 200.
Filter Type: This is our propriety smoothing method in order to make the moving averages lag less and influence the way they are calculated slightly. Type 1 being the normal calculation and type 2 being the secret sauce
Reverse MA Filter: This option allows you to use the moving average in reverse. For example, the strategy will go long when the price is above the moving average. However, if you use the reserve MA Filter, you will go short when the price is above the moving average. This method works best in sideways market where price usually retraces back to the moving average. So, in an anticipation of price reverting back to the moving average, it is a useful piece of option to use during sideway markets.
The backtester assumes the following;
- 1000$ capital
- 0.06% commission based on binance
- 1% risk meaning 100% equity on cross leverage
- Backtest results are starting from 2020
If you want to get access to this indicator please DM me or visit our website.

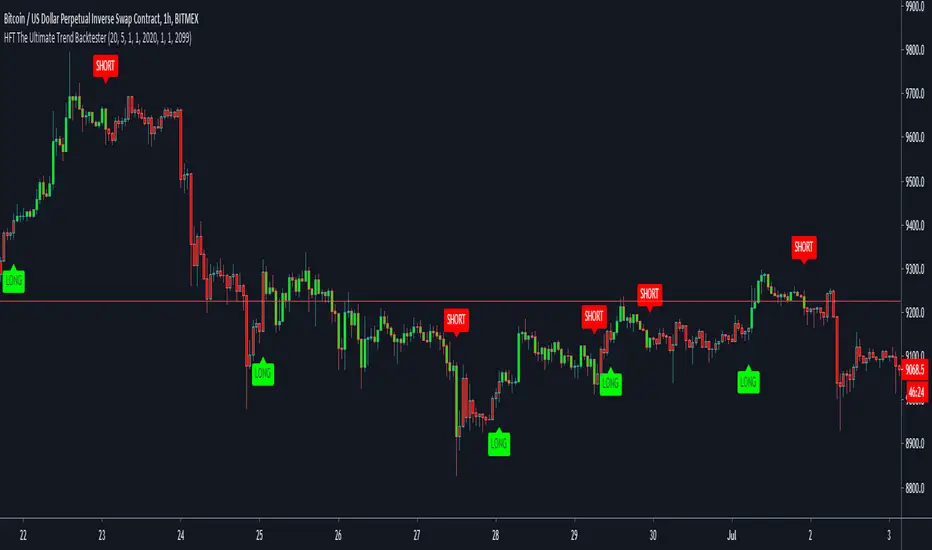
HFT The Ultimate Trend BacktesterThis is a trend following based strategy developed by HFT Research.
It works on Stocks, Forex and Cryptocurrency markets
This indicator comes fine tuned out of the box. It works on best on 15min, 1 hour and 4 hour time frames. It provides 3 separate entries for each of the time frames, providing you 12 different entry options.
Each time frame has the following options to choose from
You can use 1 hour settings on 15min chart however, it may not work the best.
Moderate entry will give you the modest amount of trades with modest amount of risk
Aggressive entry will give you wild entries and lots of action, if you are willing to babysit the trades, it might be an option for you
Conservative entry are best for those who want to automate the strategy or for those that don't have the time to trade the alerts actively
The backtester assumes the following;
- 1000$ capital
- 0.06% commission based on binance
- 1% risk meaning 100% equity on cross leverage
- Backtest results are starting from 2020
HFT Momentum BacktesterDefault Settings are meant to be used in XBT/USD chart on 1 hour time frame. If you want to use for another asset on another time frame YOU MUST CHANGE THE SETTINGS
This is momentum-based strategy designed by HFT Research in order to take advantage of volatile, trending markets.
Use ADX
ADX stands for average directional index . It is an indicator that measures volatility in the market. Unfortunately, the worst market condition for this strategy is sideways market. ADX becomes a useful tool since it can detect trend. If the volatility is low and there is no real price movement, ADX will pick that up and will not let you get in trades during a sideways market. It will allow you to enter trades only when the market is trending.
Use MA CrossOver
This strategy’s main driver is the moving average cross over however, unlike many other indicators, this strategy has ALL the moving averages that are on trading view. Total of 13 different moving averages all calculated in a different fashion available in a drop-down menu. You are able to choose two different moving averages to cross for your entry as well as being able to adjust the length of each individual moving average.
Use MA Spread % Filter
As an extra protection, we introduced MA spread % filter. We all know that momentum strategy works when there is actually a trend that has momentum. When there is no trend and market side choppy, we get a lot of noisy signals. In order to battle that we have introduced MA spread % filter. Using this piece of setting, you will be able to chose how strong the cross over actually is. If price is moving sideways, the moving averages will cross each other barely. If the price has actually any steam and momentum, MA 1 will cross over MA 2 aggressively because it will be trending market.
First you chose what the minimum % difference there should be between your 2 moving averages. If you keep this too tight, it won’t be as useful and if you keep this too large then the script will not generate any signals. Trust us, there is a fine balance in between! Then you proceed to chose your moving averages that the bot should keep track of.
Check our website for more information.
Backtest assumes the following;
You have 1000$ to trade
You use 1% of your capital on cross margin with 1% Stop Loss. Therefore, every trade has 100% equity effect on your balance and 1% stop loss has 1% loss effect
0.06% commission taking Binance as base. Please change commission if you are using another exchange.

HFT Scalper BacktesterThis strategy is a scalper strategy developed by HFT Research. Scalper is highly customizable and provides endless opportunities to find profitable setups in the market.
Use Bollinger Bands
This piece of the settings will turn and off Bollinger band’s input in the decision making. BB Length will determine the Moving average you are using to take the standard deviation off of which is named as BB Multiplier. Default settings will use 20 moving average and take standard deviation of 2 to create lower and upper bands. Increasing the Multiplier will give you fewer but safer entries.
Use Bollinger Bands %
This setting will allow the user to determine at what Bollinger band width %, he wants to take start looking to take trades. It is known that when prices are stable and moving sideways, Bollinger bands contract and it becomes more reactive to small moves in the market. Using this setting, you can ignore the signals that would be generated while Bollinger bands are contracted. This setting will allow the user to weed out the noise in the market and really allow them to make the most out of Bollinger bands .
Use RSI
You can also turn on and off the RSI as well. Alternatively, there is an option to use RSI on a different time frame than you are currently on. For example, if you are looking at the 5min chart to use Bollinger bands but you would like to look at the RSI value on the 15min chart. You can do so by selecting the custom RSI timeframe as well as adjusting the Oversold and Overbought value.
Use STOCH
For those who want extra protection on their entry can throw STOCH into their decision making. STOCH acts like RSI but it is more prone to small moves. It will help the users to get a better entry if used correctly. Stoch may not be in the buy zone when RSI is at say 35, however, if price dips a little more and STOCH might be in the buy zone when RSI is at say 20. This way it will help you have better entries than just using RSI . In a way, you can use STOCH to scalp RSI .
Use VWAP
VWAP stands for volume weighted average price . It is an extremely useful indicator when trading intra-day. It does reset every trading session which is at 00:00 UTC . Instead of looking at x number of candles and providing an average price, it will take into consideration volume that’s traded at a certain price and weigh it accordingly.
Use ADX
ADX stands for average directional index . It is an indicator that measures volatility in the market. Unfortunately, the worst market condition for this strategy is sideways market. ADX becomes a useful tool since it can detect trend. If the volatility is low and there is no real price movement, ADX will pick that up and will not let you get in trades during a sideways market. It will allow you to enter trades only when the market is trending.
Use MA Filters
Lookback: It is an option to look back x number of candles to validate the price crossing. If the market is choppy and the price keeps crossing up and down the moving average you have chosen, it will generate a lot of “noisy” signals. This option allows you to confirm the cross by selecting how many candles the price needs to stay above or below the moving average. Setting it 0 will turn it off.
MA Filter Type: There is a selection of moving averages that is available on TradingView currently. You can choose from 14 different moving average types to detect the trend as accurate as possible.
Filter Length: You can select the length of your moving average. Most commonly used length being 50,100 and 200.
Filter Type: This is our propriety smoothing method in order to make the moving averages lag less and influence the way they are calculated slightly. Type 1 being the normal calculation and type 2 being the secret sauce .
Reverse MA Filter: This option allows you to use the moving average in reverse. For example, the strategy will go long when the price is above the moving average. However, if you use the reserve MA Filter, you will go short when the price is above the moving average. This method works best in sideways market where price usually retraces back to the moving average. So in an anticipation of price reverting back to the moving average, it is a useful piece of option to use during sideway markets which is the worst market condition for scalper.
Please visit our website for more information
Quickie (Free) BacktesterQuickie is a free tradingview Indicator developed by HFT Research. It works in sideways and trending markets depending the way you set it as well as both on short time frame and long time frame. It comes with backtesting abilities on tradingview.
BITMEX:XBTUSD
Use Bollinger Bands
This piece of the settings will turn and off Bollinger band’s input in the decision making. BB Length will determine the Moving average you are using to take the standard deviation off of which is named as BB Multiplier. Default settings will use 20 moving average and take standard deviation of 2 to create lower and upper bands. Increasing the Multiplier will give you fewer but safer entries
Use RSI
You can also turn on and off the RSI as well. Alternatively, there is an option to use RSI on a different time frame than you are currently on. For example, if you are looking at the 5min chart to use Bollinger bands but you would like to look at the RSI value on the 15min chart. You can do so by selecting the custom RSI timeframe as well as adjusting the Oversold and Overbought value.
Use MA Filter
Lookback: The indicator has an option to look back x number of candles to validate the price crossing. If the market is choppy and the price keeps crossing up and down the moving average you have chosen, it will generate a lot of “noisy” signals. This option allows you to confirm the cross by selecting how many candles the price needs to stay above or below the moving average. Setting it 0 will turn it off.
MA Filter Type: There is a selection of moving averages that is available on TradingView currently. You can choose from 14 different moving average types to detect the trend as accurate as possible.
Filter Length: You can select the length of your moving average. Most commonly used length being 50,100 and 200.
Filter Type: This is our propriety smoothing method in order to make the moving averages lag less and influence the way they are calculated slightly. Type 1 being the normal calculation and type 2 being the secret sauce.
Reverse MA Filter: This option allows you to use the moving average in reverse. For example, the strategy will go long when the price is above the moving average. However, if you use the reserve MA Filter, you will go short when the price is above the moving average. This method works best in sideways market where price usually retraces back to the moving average. So, in an anticipation of price reverting back to the moving average, it is a useful piece of option to use during sideway markets.
For more information please check out our website

Crypto Trend Following StrategyThis is the strategy script indicator of Crypto Trend Following Strategy which can be used for back testing. With study script indicator, strategy can be easily automated.
To set alerts, see Crypto Trend Following Study indicator.
Script is using several moving averages to keep you on the right side of the trend. Signals are also filtered based on other indicators to prevent buying already overbought or selling already oversold coins and avoid ranging markets.
MAIN GOAL
Main goal of the strategy is long-term stable profit. No strategy has 100% accuracy therefore there always will be some false signals. But patience pays, with Trend Following Strategy, you will get couple of small loses while waiting to get big wins when coin is trending strongly. As you never know the right time you must sustain and be in all trades to make sure that you will not miss the big move.
BACKTEST
This script is for free to play with so you can back test and see for yourself how the strategy performs on any of your favourite coins.
Strategy is optimized and back tested for USDT and BTC pairs on 6h timeframe but it can be used on any pair and any timeframe.
RISK & REWARD
Strategy does not use safety orders as DCAs usually leads to bag holding sooner or later. It does not use take profit either as strategy will tell you when to buy and when to sell based on the actual market condition.
You should always use stop loss to protect your account from drawdown or even being liquidated.
You can change stop loss or take profit as you like or even back test the strategy with your preferred settings to find what suits you best.
STRATEGY SETTINGS
You can use the strategy script for fine tuning and find best settings for yourself.
If you need any help with settings do not hesitate to ask. I would also appreciate any feedback and ideas how to improve the script.
==== Indicators settings ====
RSI Long < and StochRSI Long <
• used to filter out buy signals of already overbought coins - ( stoch ) RSI must be under set value to fire a BUY signal
RSI Short > and StochRSI Short >
• used to filter out sell signals of already oversold coins - ( stoch ) RSI must be over set value to fire a SELL signal
ADX >
• used to filter out buy or sell signals in ranging markets - ADX must be over set value to fire a BUY or SELL signal
MA Fast and Slow Length
• Two moving averages to indicate an actual short-term trend
Baseline Length & Type
• Baseline is a moving average which confirms the longer-term trend. You can set length and type of the moving average
==== Test period settings ====
• You can set the back tested window
==== Strategy settings =====
• Target Take profit and Stop loss in %
• Only LONG trades – tick if you do not want to calculate SHORT trades in the back test
• Plot key levels on chart – if you use stop loss and/or take profit, you can turn on levels of price to reach (yellow – bought price, red – stop loss – green - take profit)
Back test calculates with commission and fixed order size. You can change these settings on Properties Tab

hamster-bot HiDeep strategy// DESCRIPTION OF STRATEGY
HiDeep Strategy
Author foresterufa
This is a counter-trending strategy that is gradually gaining a position against the trend at the best price.
A prerequisite for completing a position is the price exit from the internal channel on the chart and the appearance of the HiDeep indicator.
The condition for closing the position is touching the opposite side of the internal channel.
A condition for facilitating closure along the middle line of the channel, with high price volatility , is that the price touches the border of the external channel.
Input signals are generated by HiDeep indicators. Closing a position by moving averages.

Reticulata Enhanced - StrategyThis script is the backtesting for Reticulata Enhanced.
Building on our core script - Reticulata, the enhanced version features several requested extras to give you more flexibility with your trading style.
What is Reticulata Enhanced?
The Reticulata core leverages a blend of MA/RSI strategies mixed with the Bull Bear Bots optimised logic for risk management. This enhanced version takes it a step further with additional risk management features:
Trailing Stop
Fixed Stop
Fixed Stop, but move at TP
Trend confirmation
Usage
Using the indicator is as simple as:
1. Select the strategy, or combination of strategies you want to use
2. If desired, select one or more of the available trend filters
3. Adjust your stop options
4. Review backtest results
Markets
Like the core, the enhanced algo also supports a range of markets and timeframes, including the majors (EURUSD, etc...) in Forex and a variety of Cryptocurrencies including Bitcoin (BTC/XBT etc...).
All of our scripts are designed for manual traders but are ready to use with automated trading bots.

BEST Engulfing + Breakout StrategyHello traders
This is a simple algorithm for a Tradingview strategy tracking a convergence of 2 unrelated indicators.
Convergence is the solution to my trading problems.
It's a puzzle with infinite possibilities and only a few working combinations.
Here's one that I like
- Engulfing pattern
- Price vs Moving average for detecting a breakout
Definition
Take out the notebooks :) and some coffee (good for focus). I'm bullish in coffee
The engulfing pattern is a two-candle reversal pattern.
The second candle completely ‘engulfs’ the real body of the first one, without regard to the length of the tail shadows.
The bullish Engulfing pattern appears in a downtrend and is a combination of one red candle followed by a larger green candle
The bearish Engulfing pattern appears in a downtrend and is a combination of one green candle followed by a larger red candle
Example: imgur.com
We're bored sir... what's the point of all this?
In summary, an engulfing is a pattern to track reversals. (the whole TradingView audience stands up now giving a standing ovation)
Adding the Price vs Moving average filters allows to track reversals with momentums (half of the audience collapsed because this is too awesome)
Ok sir... you picked up my interest
I included some cool backtest filters:
- date range filtering
- flexible take profit in USD value (plotted in blue)
- flexible stop loss in USD value (plotted in red)
All the best
Dave

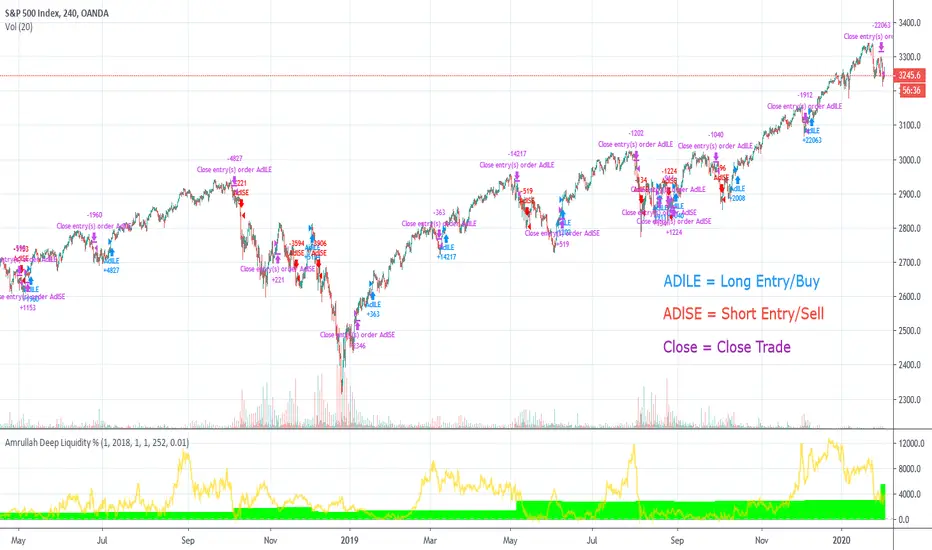
Amrullah Deep Liquidity for S&P 500Amrullah Deep Liquidity (ADL)
Amrullah Deep Liquidity (ADL) is a high profit factor strategy based on models designed by Muhd Amrullah.
Choosing your trading pair that you are planning to backtest
Check that you have been given access to Amrullah Deep Liquidity (ADL). Select SPX500USD with the default 4H time frame. Once done, open Indicators > Invite-Only Scripts > Amrullah Deep Liquidity %.
Choosing your initial capital that you want to begin backtesting
Go to Settings > Properties > Initial Capital and type in the amount of capital you're starting with. For the SPX500USD trading pair, the initial capital is denominated in USD.
Adjusting your equity at risk until the trades match your risk profile and comfort level
Go to Inputs > Equity Risk and adjust the value you are comfortable with. To analyse performance, you also want to choose the Start Year, Start Month and Start Date. Select lower equity risk for trades that you intend to take without the use of leverage. You can select an equity risk from 0.001 to 0.05 or all the way to 1.
Finding the time frame with the highest profit factor
Profit factor is defined as the gross profit a strategy makes across a defined period of time divided by its gross loss. You may choose to scroll through other time frames to find better models. You can select a different time frame from 1 min to 1H or all the way to 1M. Once you find the model you desire, you are encouraged to check that the model has a backtested profit factor of >3.5. You can then begin looking through the Performance Summary to find other detailed statistics.
Analysing the equity curve from the Amrullah Deep Liquidity (ADL) strategy
A green equity curve indicates that the trades are accumulating profits. A red equity curve indicates that the trades are accumulating losses. A healthy equity curve is one that is green and grows steadily to the right and upward direction.
Analysing the display arrows on the chart
Amrullah Deep Liquidity (ADL) tells you when to take a trade and how much to put in a trade. ADL can do this as the model identifies inventory risk in traders and market makers in the chosen market. On your Tradingview chart, ADL will display an arrow that tells you when to enter a trade. You can also see the amount to trade beside the arrow.
Opting for a trial
Yes you may opt for a trial which has limited availability.
The author's background and experience
My career in software and deep learning development spans across more than 5 years. At work, I lead a team to solve core computer vision tasks for large companies. I continually read all kinds of computer science books and papers, and follows progress on tools used in financial markets.
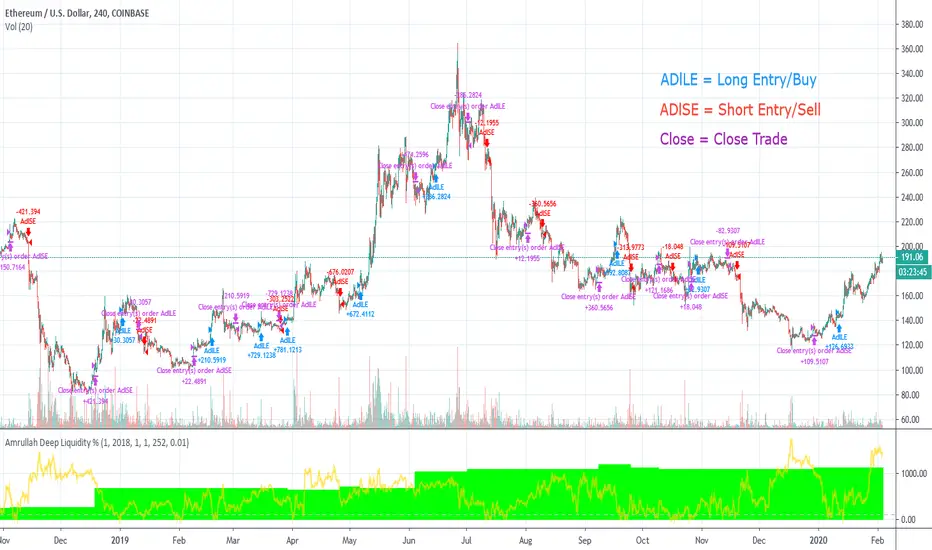
Amrullah Deep Liquidity for ETHUSDAmrullah Deep Liquidity (ADL)
Amrullah Deep Liquidity (ADL) is a high profit factor strategy based on models designed by Muhd Amrullah.
Choosing your trading pair that you are planning to backtest
Check that you have been given access to Amrullah Deep Liquidity (ADL). Select ETHUSD with the default 4H time frame. Once done, open Indicators > Invite-Only Scripts > Amrullah Deep Liquidity %.
Choosing your initial capital that you want to begin backtesting
Go to Settings > Properties > Initial Capital and type in the amount of capital you're starting with. For the ETHUSD trading pair, the initial capital is denominated in USD.
Adjusting your equity at risk until the trades match your risk profile and comfort level
Go to Inputs > Equity Risk and adjust the value you are comfortable with. To analyse performance, you also want to choose the Start Year, Start Month and Start Date. Select lower equity risk for trades that you intend to take without the use of leverage. You can select an equity risk from 0.001 to 0.05 or all the way to 1.
Finding the time frame with the highest profit factor
Profit factor is defined as the gross profit a strategy makes across a defined period of time divided by its gross loss. You may choose to scroll through other time frames to find better models. You can select a different time frame from 1 min to 1H or all the way to 1M. Once you find the model you desire, you are encouraged to check that the model has a backtested profit factor of >3.5. You can then begin looking through the Performance Summary to find other detailed statistics.
Analysing the equity curve from the Amrullah Deep Liquidity (ADL) strategy
A green equity curve indicates that the trades are accumulating profits. A red equity curve indicates that the trades are accumulating losses. A healthy equity curve is one that is green and grows steadily to the right and upward direction.
Analysing the display arrows on the chart
Amrullah Deep Liquidity (ADL) tells you when to take a trade and how much to put in a trade. ADL can do this as the model identifies inventory risk in traders and market makers in the chosen market. On your Tradingview chart, ADL will display an arrow that tells you when to enter a trade. You can also see the amount to trade beside the arrow.
Opting for a trial
Yes you may opt for a trial which has limited availability.
The author's background and experience
My career in software and deep learning development spans across more than 5 years. At work, I lead a team to solve core computer vision tasks for large companies. I continually read all kinds of computer science books and papers, and follows progress on tools used in financial markets.
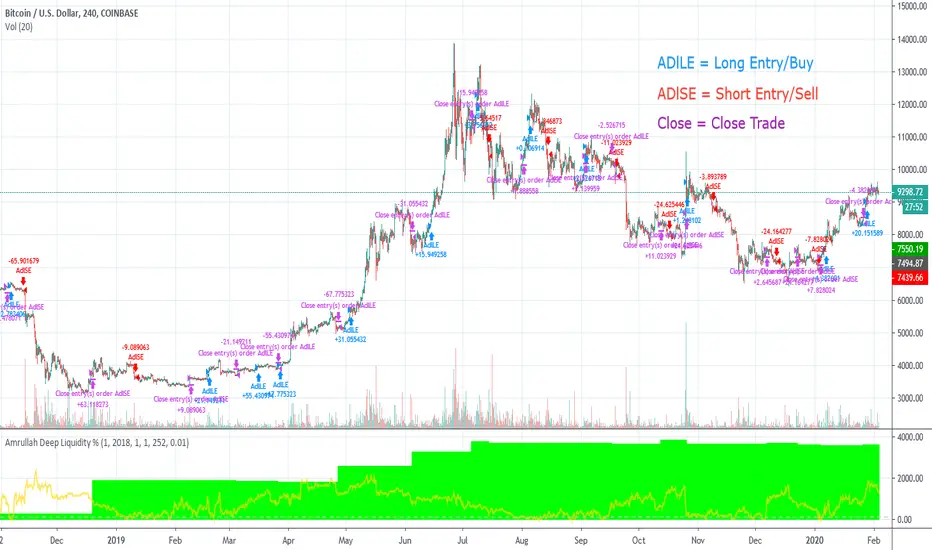
Amrullah Deep Liquidity for BTCUSDAmrullah Deep Liquidity (ADL)
Amrullah Deep Liquidity (ADL) is a high profit factor strategy based on models designed by Muhd Amrullah.
Choosing your trading pair that you are planning to backtest
Check that you have been given access to Amrullah Deep Liquidity (ADL). Select BTCUSD with the default 4H time frame. Once done, open Indicators > Invite-Only Scripts > Amrullah Deep Liquidity %.
Choosing your initial capital that you want to begin backtesting
Go to Settings > Properties > Initial Capital and type in the amount of capital you're starting with. For the BTCUSD trading pair, the initial capital is denominated in USD.
Adjusting your equity at risk until the trades match your risk profile and comfort level
Go to Inputs > Equity Risk and adjust the value you are comfortable with. To analyse performance, you also want to choose the Start Year, Start Month and Start Date. Select lower equity risk for trades that you intend to take without the use of leverage. You can select an equity risk from 0.001 to 0.05 or all the way to 1.
Finding the time frame with the highest profit factor
Profit factor is defined as the gross profit a strategy makes across a defined period of time divided by its gross loss. You may choose to scroll through other time frames to find better models. You can select a different time frame from 1 min to 1H or all the way to 1M. Once you find the model you desire, you are encouraged to check that the model has a backtested profit factor of >3.5. You can then begin looking through the Performance Summary to find other detailed statistics.
Analysing the equity curve from the Amrullah Deep Liquidity (ADL) strategy
A green equity curve indicates that the trades are accumulating profits. A red equity curve indicates that the trades are accumulating losses. A healthy equity curve is one that is green and grows steadily to the right and upward direction.
Analysing the display arrows on the chart
Amrullah Deep Liquidity (ADL) tells you when to take a trade and how much to put in a trade. ADL can do this as the model identifies inventory risk in traders and market makers in the chosen market. On your Tradingview chart, ADL will display an arrow that tells you when to enter a trade. You can also see the amount to trade beside the arrow.
Opting for a trial
Yes you may opt for a trial which has limited availability.
The author's background and experience
My career in software and deep learning development spans across more than 5 years. At work, I lead a team to solve core computer vision tasks for large companies. I continually read all kinds of computer science books and papers, and follows progress on tools used in financial markets.
Amrullah Deep Liquidity for ETHBTCAmrullah Deep Liquidity (ADL)
Amrullah Deep Liquidity (ADL) is a high profit factor strategy based on models designed by Muhd Amrullah.
Choosing your trading pair that you are planning to backtest
Check that you have been given access to Amrullah Deep Liquidity (ADL). Select ETHBTC with the default 2H time frame. Once done, open Indicators > Invite-Only Scripts > Amrullah Deep Liquidity %.
Choosing your initial capital that you want to begin backtesting
Go to Settings > Properties > Initial Capital and type in the amount of capital you're starting with. For the ETHBTC trading pair, the initial capital is denominated in BTC.
Adjusting your equity at risk until the trades match your risk profile and comfort level
Go to Inputs > Equity Risk and adjust the value you are comfortable with. To analyse performance, you also want to choose the Start Year, Start Month and Start Date. Select lower equity risk for trades that you intend to take without the use of leverage. You can select an equity risk from 0.001 to 0.05 or all the way to 1.
Finding the time frame with the highest profit factor
Profit factor is defined as the gross profit a strategy makes across a defined period of time divided by its gross loss. You may choose to scroll through other time frames to find better models. You can select a different time frame from 1 min to 1H or all the way to 1M. Once you find the model you desire, you are encouraged to check that the model has a backtested profit factor of >3.5. You can then begin looking through the Performance Summary to find other detailed statistics.
Analysing the equity curve from the Amrullah Deep Liquidity (ADL) strategy
A green equity curve indicates that the trades are accumulating profits. A red equity curve indicates that the trades are accumulating losses. A healthy equity curve is one that is green and grows steadily to the right and upward direction.
Analysing the display arrows on the chart
Amrullah Deep Liquidity (ADL) tells you when to take a trade and how much to put in a trade. ADL can do this as the model identifies inventory risk in traders and market makers in the chosen market. On your Tradingview chart, ADL will display an arrow that tells you when to enter a trade. You can also see the amount to trade beside the arrow.
Opting for a trial
Yes you may opt for a trial which has limited availability.
The author's background and experience
My career in software and deep learning development spans across more than 5 years. At work, I lead a team to solve core computer vision tasks for large companies. I continually read all kinds of computer science books and papers, and follows progress on tools used in financial markets.
