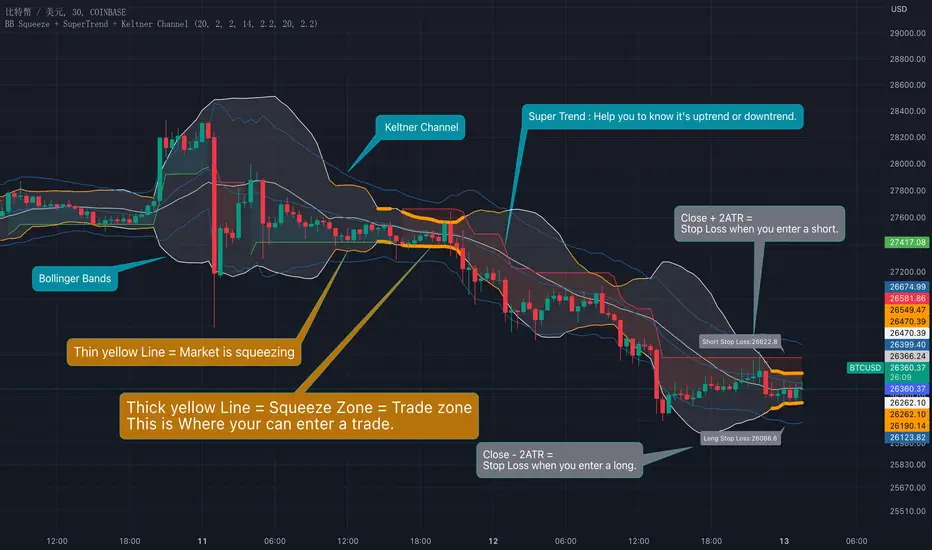
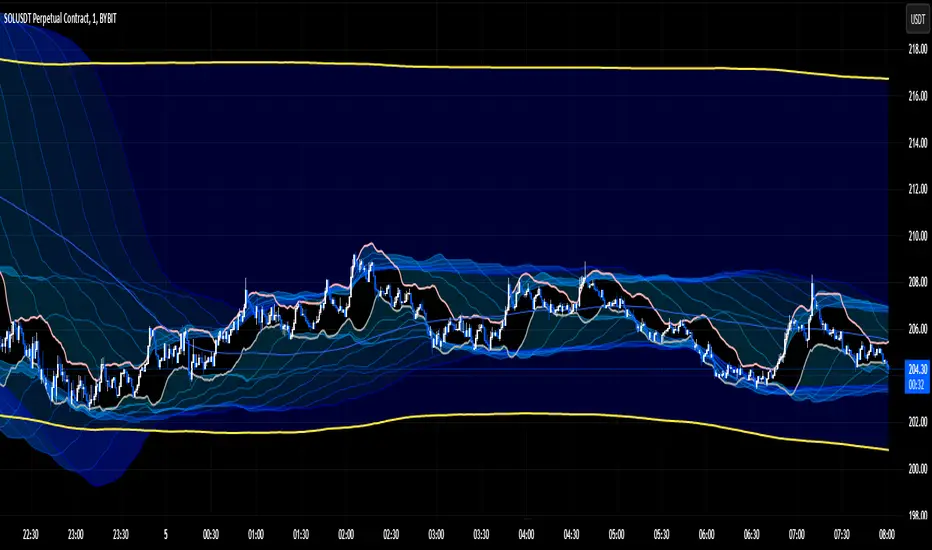
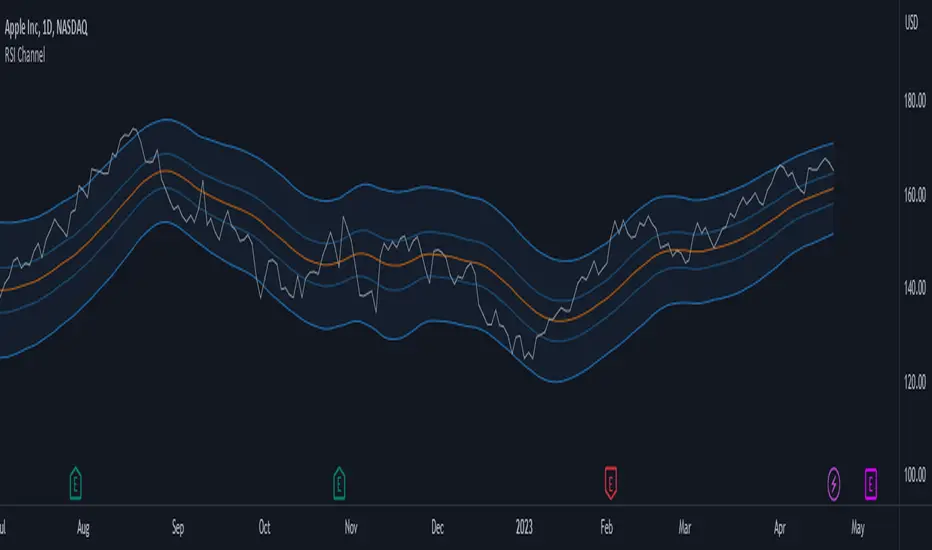
Cuban's Reversion Bands V2Cuban's Reversion Bands V2
Cubans Reversion Bands, are a great indication of price overextension by using specified standard deviations, extended from a moving average basis line, the Volume Weighted Average Trend.
Reversion Bands V2 builds off the original foundation in a big way but utilizes completely new band logic and a more stable basis line, the stability leads to a more consistent band reversion zones.
The basis line is calculated with volatility metrics and long term range determinants.
The band extension points are then weighted on this basis line with the asset's average extensions taken into consideration to fit each asset individually.
Users gain the ability to customize:
EQ Sensitivity
Band Sensitivity
EQ sensitivity will control the reaction time of the basis line e.g. a comparison of the default 1, and below an increase EQ to 100:
1 EQ Sensitivity (Default)
100 EQ Sensitivity
Band Sensitivity will control the distance of deviation from the basis point, this can be used to fine tune the reversion location which could be useful in higher beta environments.
1 Band Sensitivity
100 Band Sensitivity
As a result of overextension we can take this as a means for a potential market shift, for example, in range bound conditions we expect the market to revert at the given reversion zones in the Cuban Reversion Bands V2.
Failure to revert at a band level, and extension above could signify a change in market structure and lead to a trending environment thus giving us the ability to determine a trending environment.
To Do:
alerts
implement additional confluence via other proprietary tools to increase the signal ratio
Bands
Trop BandsTrop Bands is a tool that uses an exponential moving average (EMA) as its central trendline and upper and lower bands to identify potential buying and selling opportunities in the market. The bands are calculated based on recent moves away from the EMA, and they are plotted around the central trendline to provide a visual representation of market trends and conditions. When the price moves outside of these bands, it can be seen as a signal that the security is overbought or oversold and may be ready for a reversal, just like Bollinger Bands.
In addition to providing signals when the price moves outside of the bands, the indicator can also show triangles outside/inside the bands. These triangles are based on the Demand Index developed by James Sibbet and are intended to provide additional confirmation of potential trading opportunities. They can be used in conjunction with other technical analysis tools to help identifying potential trading opportunities in the market.
MA ChannelThis indicator creates a high and low channel of moving average type selected, it also can draw deviation bands based on the channel for a unique representation of squeezes.
Features
Moving average channel displays constant high and low price trend.
Center band displays color representative of trend direction constantly.
High price trend line disappears during downtrends, and low price trend line disappears during uptrends.
Deviation band display accurately reports squeezes between price and channel data.
Deviation band fill reports price range expansion as possible trend weakness.
Settings
Period adjusts historical price data to use for trend analysis.
Average Type adjusts the type of average calculation used in the trend plots.
Show Deviation Band toggles display of deviation bands and their fill.
Deviation Multiplier adjusts the deviation calculation, 2.0 is common.
Style adjustments include up/down trend strong/weak color customization (default theme supports color blindness).
Color Bar displays overall trend color on each bar.
Deviation Band Fill With Squeeze Measurement adjusts opacity to represent deviation band squeeze, when bands contract the colors disappear, when bands expand the colors reappear.
Usage
Trend Analysis
When price has broken above the channel then it's an uptrend, price below the channel is a downtrend.
Pay attention to when inverse trend line appears only momentarily, these could be excellent trend continuation entry areas.
Reversals
Reversal areas can be spotted where price breaks the channel central ribbon but doesn't close outside on the opposite end of previous trend.
Squeeze
Band fill squeeze mode aims to make it a simple task to see when a squeeze may be weakening, with the color trend brightening during periods of expansion, and disappearing during periods of contraction (squeezing).
Gedhusek ScalpingRangerThis indicator was designed for finding good entries for scalping the market
How does it work:
- It works on a basis of price running out of its bands and its return
- Once the price is out of bands, the system starts scanning for two patterns --> sudden price reversion and losing of momentum.
- If any of these patterns occur, the indicator waits for a confirmation bar and after that it gives you a signal that the price could be moving upwards or downwards.
- These signals are represented by a label and sudden price change of the current bar
- Also you will see a dotted line above or below the bar that can be used as a potential Stop Loss level
Idea behind the trigger patterns:
Sudden price reversion
- Idea behind this pattern is that the price has a higher success of reversion if there is a fast change of its momentum. This pattern is recognized by measuring the divergence between prior and current price change
- The divergence is measured as correlation between shorter-term price action and longer-term price action. If the correlation is negative and statistically significant, it is counted as a reversion signal (= shorter-time price action goes in the opposite direction of longer-term price action)
Losing of momentum
- The idea behind this pattern is that once there is no strong momentum, there is lower probability of a breakout and start of strong trend
- It is calculated as a difference between current price and previous price. If the difference is minimal, it is taken as a signal that the price lost its momentum and therefore there is higher chance of reversion.
When to use:
- This indicator works well in ranging markets, but slightly less well in trending markets. Therefore look for sideways markets and use the indicator there
- Price action patterns work really well with this indicator, such as Support and Resistance levels, double Tops and Bottoms,...
Inputs:
- This indicator has only one input and that is "Analysis Period". This input declares how many bars and going to be used when finding the patterns of possible price reversion
Correlated ATR Bands | AdulariHow do I use it?
Never use this indicator as standalone trading signal, it should be used as confluence.
It is highly recommended to use this indicator on the 15m timeframe and above, try experimenting with the inverse feature and multipliers as well.
When the price is above the moving average this shows the bullish trend is strong.
When the price is below the moving average this shows the bearish trend is strong.
When the moving average is purple, the trend is bullish , when it is gray, the trend is bearish.
When price is above the upper band this may indicate a bearish reversal.
When price is below the lower band this may indicate a bullish reversal.
Features:
Purple line for bullish trend and gray line for bearish trend.
Custom formula combining an ATR and Hull MA to clearly indicate trend strength and direction.
Unique approach to moving averages and bands by taking the average of 2 types of MA's combined with custom ATR's, then multiplying these by correlation factors.
Bands to indicate possible trend reversals when price crosses them.
How does it work?
1 — ATR value is calculated, then the correlation between the source and ATR is calculated.
2 — Final value is calculated using the following formula:
correlation * atr + (1 - correlation) * nz(atr , atr)
3 — Moving average is calculated with the following formula:
ta.hma((1-(correlation/100*(1+weight/10)))*(ta.sma(source+value, smoothing)+ta.sma(source-value,smoothing))/2,flength)
4 — Bands calculation using multipliers.
[EDU] RSI Momentum BandsRSI Momentum Bands serve a purpose to find best RSI momentum for entering a trade.
Indicator is built simply:
1st RSI MA is smoothed RSI by little period, 2nd RSI MA is smoothed RSI by a bigger period.
Then we calculate standard deviation from the 2nd MA and make upper and lower band.
The rules for trades are simple:
When RSI is above higher band - Buy ;
When RSI is below lower band - Sell .
The indicator is for educational purposes only to present trades a momentum bands concepts, widely used across professionals.
Hope you will find it helpful.
Take your profits!
- Tarasenko Fyodor
Cyclic Polygamma BandsThe polygamma function is the (n+1)st derivative of the logarithm of the gamma function where n is the respective order. An approximation of this derivative at order n=1 is taken and applied to my own calculation of upper and lower bands (along with a mean), to create the cyclic polygamma bands. Cyclic, as it is weighted to mimic the local alternations in price (peak to trough corresponding to turning points of a set of moving averages). Lower cyclic weights for trending markets, higher cyclic weights correspond to choppier markets. It has 3 plots. The CP-H, CP-Mean and CP-L, where the CP-H is the red band, CP-L is the green band and CP-Mean the mean of these 2 bands. The method of trading is dependent on the user, but generally in an (here, undefined) uptrend, prices that snap the CP-L are considered bullish. Same logic for shorts and the CP-H.
The raw calculation is the unfiltered calculation. Cyclic is recommended, but the CP-Mean has exhibited interesting behavior (use at your own discretion). Cyclic aims to follow the local cycles of price.
Low cyclic weight will allow the weight of the polygamma to be higher. High cyclic weight will mimic price more, responding quicker to price. Use high if markets are chopping.
MTF MA Ribbon and Bands + BB, Gaussian F. and R. VWAP with StDev█ Multi Timeframe Moving Average Ribbon and Bands + Bollinger Bands, Gaussian Filter and Rolling Volume Weighted Average Price with Standard Deviation Bands
Up to 9 moving averages can be independently applied.
The length , type and timeframe of each moving average are configurable .
The lines, colors and background fill are customizable too.
This script can also display:
Moving Average Bands
Bollinger Bands
Gaussian Filter
Rolling VWAP and Standard Deviation Bands
Types of Moving Averages:
Simple Moving Average (SMA)
Exponential Moving Average (EMA)
Smoothed Moving Average (SMMA)
Weighted Moving Average (WMA)
Volume Weighted Moving Average (VWMA)
Least Squares Moving Average (LSMA)
Hull Moving Average (HMA)
Arnaud Legoux Moving Average (ALMA)
█ Moving Average
Moving Averages are price based, lagging (or reactive) indicators that display the average price of a security over a set period of time.
A Moving Average is a good way to gauge momentum as well as to confirm trends, and define areas of support and resistance.
█ Bollinger Bands
Bollinger Bands consist of a band of three lines which are plotted in relation to security prices.
The line in the middle is usually a Simple Moving Average (SMA) set to a period of 20 days (the type of trend line and period can be changed by the trader, a 20 day moving average is by far the most popular).
The SMA then serves as a base for the Upper and Lower Bands which are used as a way to measure volatility by observing the relationship between the Bands and price.
█ Gaussian Filter
Gaussian filter can be used for smoothing.
It rejects high frequencies (fast movements) better than an EMA and has lower lag.
A Gaussian filter is one whose transfer response is described by the familiar Gaussian bell-shaped curve.
In the case of low-pass filters, only the upper half of the curve describes the filter.
The use of gaussian filters is a move toward achieving the dual goal of reducing lag and reducing the lag of high-frequency components relative to the lag of lower-frequency components.
█ Rolling VWAP
The typical VWAP is designed to be used on intraday charts, as it resets at the beginning of the day.
Such VWAPs cannot be used on daily, weekly or monthly charts. Instead, this rolling VWAP uses a time period that automatically adjusts to the chart's timeframe.
You can thus use the rolling VWAP on any chart that includes volume information in its data feed.
Because the rolling VWAP uses a moving window, it does not exhibit the jumpiness of VWAP plots that reset.
Made with the help from scripts of: adam24x, VishvaP, loxx and pmk07.
RSI Shadow by TartigradiaHave you ever wondered how much the RSI can vary during an open session? How much wicks can make the RSI overshoots before it retraces for the close?
This indicator plots the RSI shadow, which is the area between the highest and lowest RSI values attained during each open session, from the high/low wick price candle (ie, not the open value).
Technically, we calculate the RSI as usual for all past bars, except for current bar for which we use the high and low values to calculate the RSI Shadow bounds. The invisible PineScript loop then repeats this process for each bar.
In practice, the RSI Shadow provides 2 different informations:
1. This allows to visually represent the variability that historically happened for each bar, which help in better understanding the context at the time and may help predict future similar patterns.
2. The closer the RSI is to one bound, high or low, the more bullish or bearish respectively the price action is. Intuitively, when RSI is close to the high shadow bound, it means that price action is so bullish it often closes in proximity to the highest value attained during the open session, hence very bullish sentiment. And inversely for low and bearish sentiment. To ease visualization of these sentiments, a background highlighting is provided.
The indicator works under all timeframes, but it appears to provide a very reliable information with longer timeframe. The background highlighting showing the bullish/bearish sentiment based on the RSI Shadow appears to indicate crypto market cycles relatively reliably, with 2-3 consecutive bars with the same background color indicating a strong trend.
False positives can be reduced by looking at both the background color and the RSI direction, if both are congruent (ie, both bullish), then the trend indication is good, otherwise the trend indicated by the background color should be disregarded. An option was added to uncolor background if incongruent with RSI's direction.
There is also a "shadow margin" setting that allows to further reduce the number of false positives, at the expense of reduced sensitivity (a margin of 3 seems to eliminate most false positives).
Note: if you need a more complete RSI indicator with overbought/oversold signals, check out RSI+ (alt), which includes all RSI related indicators I make (such as RSI Shadow):
Volume Weighted Reversal BandsThis is a vwap & vwma hybrid with upper & lower deviation bands that provide excellent price channels and reversal areas. It can be used on lower & higher timeframes, just increase the deviation % for higher timeframes. Try out the 1 minute timeframe with .5% deviation for great scalping levels.
Here is the calculation used for the main line.
(VWMA100 + VWMA500 + VWMA1000 + VWAP) / 4
So it combines 3 VWMAs with the VWAP and divides that number by 4 to give us a moving average. Then we add new levels above and below that moving average to get our channels. The channels are separated by the % deviation you choose in the settings. For tighter bands, lower the percentage deviation and for wider bands, increase the percentage deviation.
The fattest line in the middle is the main moving average and you can expect price to regularly return to this level. The thick lines are the main moving average plus or minus the percentage deviation you have set. There are 10 levels in each direction from the main moving average. The is also a thin short term moving average as well with a custom calculation. It takes 4 different length moving averages that are weighted and 4 more that are volume weighted and divides the total by 8.The lines will be green when price is above the line and red when price is below the line. The thin white line is the VWAP on its own.
These lines will act as dynamic support and resistance so you can scalp them back and forth. These levels work so well because they are volume weighted and the algos hedge their positions back and forth constantly.
For best results, use this indicator on tickers with the highest volume and trading action as the price will stick to these levels better when the big money players are hedging. Some great tickers for this indicator are APPL, SPY, BTC, ETH.
All colors and linewidths can be customized in the settings easily as well as turning off the VWAP or short moving average and adjusting the percentage deviation for the channels.
***MARKETS***
This indicator can be used on all markets, including stocks, crypto, futures and forex.
***TIMEFRAMES***
This indicator can be used on all timeframes.
***TIPS***
Try using numerous indicators of ours on your chart for extra confirmation. Our favorites to pair with these bands are the Scalper Ribbon and Trend Friend Signals. The 3 combined give you a lot of extra confirmation on whether the market is going to reverse at these levels.
Trend ExplosionThis script features a combination of trend indicators. Upon backtesting various indicators and how price action reacts to past signals, I discovered that using a combination of conditions would allow for a simple, easy-to-use, yet (in my opinion) accurate representation of current market sentiment. I typically use this on the 5/15 minute charts as I reference higher timeframe conditions. If you would like to trade the 1 hour and above timeframes, you would have to manually adjust the timeframe you want under "Resolution". Another thing to note is that this script provides a REFERENCE for trends. It does not provide entry and exit signals and you would have to discretionarily determine those yourself.
Long sentiment = Green triangles below the bar
Short sentiment = Fuchsia triangles above the bar
Due to a large amount of effort and time taken into creating this script, I have decided to protect the source code. If you do have any suggestions, you can feel free to drop me a DM.
Trend BandsThis script is, yet again, another mean reversion indicator. When the trend index touches the upper / lower bands, there seems to be a decent probability that the market might reverse at that area. However, I do emphasise on exercising caution when trading against the current wave of the market as there are instances where the trend index extends past the upper / lower bands for a prolonged period of time. However, in a non-trending semi-consolidated market, this script seems to do quite well for itself. Enjoy!
Parkinson's Historical Volatility Bands [Loxx]Parkinson's Historical Volatility Bands are constructed using:
Average as the middle line.
Upper and lower bands using the Parkinson's historical volatility (instead of "regular" Historical Volatility) for bands calculation.
What is Parkinson's Historical Volatility?
The Parkinson's number, or High Low Range Volatility developed by the physicist, Michael Parkinson in 1980, aims to estimate the Volatility of returns for a random walk using the High and Low in any particular period. IVolatility.com calculates daily Parkinson values. Prices are observed on a fixed time interval: n = 10, 20, 30, 60, 90, 120, 150, 180 days.
SH is stock's High price in t day.
SL is stock's Low price in t day.
High/Low Return (xt^HL) is calculated as the natural logarithm of the ratio of a stock's High price to stock's Low price.
Return:
And Parkinson's number: 1 / (4 * math.log(2)) * 252 / n * Σ (n, t =1) {math.log(Ht/Lt)^2}
An important use of the Parkinson's number is the assessment of the distribution prices during the day as well as a better understanding of the market dynamics. Comparing the Parkinson's number and periodically sampled volatility helps traders understand the tendency towards mean reversion in the market as well as the distribution of stop-losses.
The color of the middle line, unlike the bands colors, has 3 colors. When colors of the bands are the same, then the middle line has the same color, otherwise it's white.
Included
Alerts
Signals
Loxx's Expanded Source Types
Bar coloring
Historical Volatility Bands [Loxx]Historical Volatility Bands are constructed using:
Average as the middle line.
Upper and lower bands using the Historical Volatility for bands calculation.
What is Historical Volatility?
Historical Volatility (HV) is a statistical measure of the dispersion of returns for a given security or market index over a given period of time. Generally, this measure is calculated by determining the average deviation from the average price of a financial instrument in the given time period. Using standard deviation is the most common, but not the only, way to calculate Historical Volatility.
The higher the Historical Volatility value, the riskier the security. However, that is not necessarily a bad result as risk works both ways - bullish and bearish, i.e: Historical Volatility is not a directional indicator and should not be used as other directional indicators are used. Use to to determine the rising and falling price change volatility.
The color of the middle line, unlike the bands colors, has 3 colors. When colors of the bands are the same, then the middle line has the same color, otherwise it's white.
Included
Alerts
Signals
Loxx's Expanded Source Types
Bar coloring
ATR Trend Bands [Misu]█ This indicator shows an upper and lower band based on price action and ATR (Average True Range)
The average true range (ATR) is a market volatility indicator used in technical analysis.
█ Usages:
The purpose of this indicator is to identify changes in trends and price action.
It is mainly used to identify breaking points and trend reversals.
But it can also be used to show resistance or support levels.
█ Features:
> Buy & Sell Alerts
> Buy & Sell Labels
> Color Bars
> Show Bands
█ Parameters:
Length: Length is used to calculate ATR.
Atr Multiplier: A factor used to balance the impact of the ATR on the Trend Bands calculation.
RSI + MA, LinReg, ZZ (HH HL LH LL), Div, Ichi, MACD and TSI HistRelative Strength Index with Moving Average, Linear Regression, Zig Zag (Highs and Lows), Divergence, Ichimoku Cloud, Moving Average Convergence Divergence and True Strength Index Histogram
This script is based on zdmre's RSI script, I revamped a lot of things and added a few indicators from ParkF's RSI script.
Disable Labels in the Style tab and the histogram if you don't enlarge the indicator and it seems too small.
Look to buy in the oversold area and bounce of the support of the linear regression.
Look to sell in the overbought area and bounce of the resistance of the linear regression.
Look for retracement to the moving average or horizontal lines, and divergences for potential reversal.
RSI
The Relative Strength Index (RSI) is a well versed momentum based oscillator which is used to measure the speed (velocity) as well as the change (magnitude) of directional price movements.
Moving Average
Moving Average (MA) is a good way to gauge momentum as well as to confirm trends, and define areas of support and resistance.
Linear Regression
The Linear Regression indicator visualizes the general price trend of a specific part of the chart based on the Linear Regression calculation.
Zig Zag (Highs and Lows)
The Zig Zag indicator is used to identify price trends, and in doing so plots points on the chart to mark whenever prices reverse by a larger percentage point than a predetermined variable or marker.
Divergence
The divergence indicator warns traders and technical analysts of changes in a price trend, oftentimes that it is weakening or changing direction.
Ichimoku Cloud
The Ichimoku Cloud is a package of multiple technical indicators that signal support, resistance, market trend, and market momentum.
MACD and TSI Histogram
MACD can be used to identify aspects of a security's overall trend.
The True Strength Index indicator is a momentum oscillator designed to detect, confirm or visualize the strength of a trend.
VWAP BANDS [qrsq]Description
This indicator is used to find support and resistance utilizing both buying and selling volume. It can be used on lower and higher time frames to understand where price is likely to reject or bounce.
How it works
Instead of calculating the VWAP using the total volume, this script estimates the buying/selling volume and respectively calculates their individual VWAP's. The standard deviations of these are then calculated to create the set of two bands. The top bands being the VWAP from buying volume and bottom bands are from selling volume, with the option to use a double band on either pair.
How to use it
I like to use the bands for LTF scalping as well as HTF swings, I also like to use it alongside my SMA VWAP BANDS.
For scalping:
I tend to use either the 5m or 15m TF
I then set the indicator's TF to 1m
I will take a scalp based on the bands confluence with other PA methods, if price is being either supported or rejected.
For swings:
I tend to use a variety of TFs, including: 30m, 1H, 4H, D
I then set the indicator's TF to "Chart"
I will take a swing based on the bands confluence with other PA methods, if price is being either supported or rejected.
I also tend to use them on perpetual contracts as the volume seems to be more consistent and hence results in more accurate support and resistance.
Pivot-Based Channels & Bands [Misu]█ This Indicator is based on Pivot detection to show bands and channels.
The pivot price is similar to a resistance or support level. If the pivot level is breached, the price should continue in that direction. Or the price could reverse at or near this level.
█ Usages:
Use channels as a support & resistance zone.
Use bands as a support & resistance zone. It is also very powerfull to use it as a breakout.
Use mid bands & mid channels as a trend direction or trade filter as a more usual moving average.
█ Parameters:
Show Pivot Bands: show bands.
Show Pivot Mid Band: show mid bands.
Show Pivot Channels: show channels.
Show Pivot Mid Channel: show mid channels.
Deviation: deviation used to calculate pivot points.
Depth: depth used to calculate pivot points.
MTF EMA Ribbon & Bands + BBMulti Timeframe Exponential Moving Average Ribbon & Bands + Boillinger Bands
I used the script "EMA Ribbon - low clutter, configurable " by adam24x, I made some color change and I added a few indicators (Boillinger Bands, EMA on multi timeframe and EMA bands from "34 EMA Bands " by VishvaP).
The script can display various EMA from the chart's timeframe but also EMA from other timeframes.
Bollinger Bands and EMA bands can also be added to the chart.
Ultimate IndicatorThis is a combination of all the price chart indicators I frequently switch between. It contains my day time highlighter (for day trading), multi-timeframe long-term trend indicator for current commodity in the bottom right, customizable trend EMA which also has multi-timeframe drawing capabilities, VWAP, customizable indicators with separate settings from the trend indicator including: EMA, HL2 over time, Donchian Channels, Keltner Channels, Bollinger Bands, and Super Trend. The settings for these are right below the trend settings and can have their length and multiplier adjusted. All of those also have multi-timeframe capabilities separate from the trend multi-time settings.
The Day Trade Highlight option will draw faint yellow between 9:15-9:25, red between 9:25-9:45, yellow between 9:45-10:05. There will be one white background at 9:30am to show the opening of the market. while the market is open there will be a very faint blue background. For the end of the day there will be yellow between 15:45-15:50, red between 15:50-16:00, and yellow between 16:00-16:05. During the night hours, there is no coloring. The purpose of this highlight is to show the opening / closing times of the market and the hot times for large moves.
The indicators can also be colored in the following ways:
1. Simple = Makes all colors for the indicator Gray
2. Trend = Will use the Donchian Channels to get the short-trend direction and by default will color the short-term direction as Blue or Red. Unless using Super Trend, the Donchian Channel is used to find short-term trend direction.
3. Trend Adv = Will use the Donchian Channels to get the short-trend direction and by default will color the short-term direction as Blue or Red. Unless using Super Trend, the Donchian Channel is used to find short-term trend direction. If there is a short-term up-trend during a long-term down-trend, the Blue will become Navy. If short-term down-trend during long-term up-trend, the Red will be Brown.
4. Squeeze = Compares the Bollinger Bands width to the Keltner Channels width and will color based on relative squeeze of the market: Teal = no squeeze. Yellow = little squeeze. Red = decent squeeze. White = huge squeeze. if you do not understand this one, try drawing the Bollinger Bands while using the Squeeze color option and it should become more apparent how this works. I also recommend leaving the length and multiplier to the default 20 and 2 if using this setting and only changing the timeframe to get longer/shorter lengths as I've seen that changing the length or multiplier can more or less make it not work at all.
Along with the indicator settings are options to draw lines/labels/fills for the indicator. I enjoy having only fills for a cleaner look.
The Labels option will show Buy/Sell signals when the short-term trend flips to agree with the long-term trend.
The Trend Bars option will do the same as the Labels option but instead will color the bars white when a Buy/Sell option is given.
The Range Bars option shows will color a bar white when the Close of a candle is outside of a respective ranging indicator option (Bollinger or Keltner).
The Trend Bars will draw white candles no matter which indicator selection you make (even "Off"). However, Range Bars will only draw white when either Bollinger or Keltner are selected.
The Donchian Channels and Super Trend are trending indicators and should be used during trending markets. I like to use the MACD in conjunction with these indicators for possibly earlier entries.
The Bollinger Bands and Keltner Channel are ranging indicators and should be used during ranging markets. I like to use the RSI in conjunction with these indicators and will use 60/40 for overbought and oversold areas rather than 70/30. During a range, I wait for an overbought or oversold indication and will buy/sell when it crosses back into the middle area and close my position when it touches the opposite band.
I have a MACD/RSI combination indicator if you'd like that as well :D
As always, trade at your own risk. This is not some secret indicator that will 100% win. As always, the trades you see in the picture use a 1:1.5 or 1:2 risk to reward ratio, for today (August 8, 2022) it won 5/6 times with one trade still open at the end of the day. Manage your account correctly and you'll win in the long term. Hit me up with any questions or suggestions. Happy Trading!
MTF VWAP & StDev BandsMulti Timeframe Volume Weighted Average Price with Standard Deviation Bands
I used the script "Koalafied VWAP D/W/M/Q/Y" by Koalafied_3 and made some changes, such as adding more standard deviation bands.
The script can display the daily, weekly, monthly, quarterly and yearly VWAP.
Standard deviation bands values can be changed (default values are 0.618, 1, 1.618, 2, 2.618, 3).
Also the previous standard deviation bands can be displayed.
Value At Risk Channel [AstrideUnicorn]The Value at Risk Channel (VaR Channel) is a trading indicator designed to help traders control the level of risk exposure in their positions. The user can select a time period and a probability value, and the indicator will plot the upper and lower limits that the price can reach during the selected time period with the given probability.
CONCEPTS
The indicator is based on the Value at Risk (VaR) calculation. VaR is an important metric in risk management that quantifies the degree of potential financial loss within a position, portfolio or company over a specific period of time. It is widely used by financial institutions like banks and investment companies to forecast the extent and likelihood of potential losses in their portfolios.
We use the so-called “historical method” to compute VaR. The algorithm looks at the history of past returns and creates a histogram that represents the statistical distribution of past returns. Assuming that the returns follow a normal distribution, one can assign a probability to each value of return. The probability of a specific return value is determined by the distribution percentile to which it belongs.
HOW TO USE
Let’s assume you want to plot the upper and lower limits that price will reach within 4 hours with 5% probability. To do this, go to the indicator Settings tab and set the Timeframe parameter to "4 hours'' and the Probability parameter to 5.0.
You can use the indicator to set your Stop-Loss at the price level where it will trigger with low probability. And what's more, you can measure and control the probability of triggering.
You can also see how likely it is that the price will reach your Take-Profit within a specific period of time. For example, you expect your target level to be reached within a week. To determine this probability, set the Timeframe parameter to "1 week" and adjust the Probability parameter so that the upper or lower limit of your VaR channel is close to your Take-Profit level. The resulting Probability parameter value will show the probability of reaching your target in the expected time.
The indicator can be a useful tool for measuring and managing risk, as well as for developing and fine-tuning trading strategies. If you find other uses for the indicator, feel free to share them in the comments!
SETTINGS
Timeframe - sets the time period, during which the price can reach the upper or lower bound of the VaR channel with the probability, set by the Probability parameter.
Probability - specifies the probability with which the price can reach the upper or lower bound of the VaR channel during the time period specified by the Timeframe parameter.
Window - specifies the length of history (number of historical bars) used for VaR calculation.
DEMA Supertrend Bands [Misu]█ Indicator based on DEMA (Double Exponential Moving Average) & Supertrend to show Bands .
DEMA attempts to remove the inherent lag associated with Moving Averages by placing more weight on recent values.
Supertrend aims to detect price trends, it's also used to set protective stops.
█ Usages:
Combining Dema to calculate Supertrend results in nice lower and upper bands.
This can be used to identify potential supports and resistances and set protective stops.
█ Parameters:
Length DEMA: Double Ema lenght used to calculate DEMA. Dema is used by Supertrend indicator.
Length Atr: Atr lenght used to calculate Atr. Atr is used by Supertrend indicator.
Band Mult: Used to calculate Supertrend Bands width.
█ Other Applications:
The mid band can be used to filter bad signals in the manner of a more classical Moving Average.