BBAWE 事件合約This is a paid version. Please contact me or follow me.
✅ Key Features
Strict 1-bar confirmation for cleaner entries.
Fast EMA filter to avoid false breakouts.
Cooldown system to reduce overtrading.
Visual markers for Key Bars and trade entries.
Fully customizable parameters (BB period, EMA length, cooldown bars).
📈 Best Suited For
Short-term scalping or intraday setups.
Catching quick reversals or momentum continuation.
Traders who need stricter signal validation to filter noise.
Bands and Channels

event contract boll 事件合約Bollinger Bands (BB)
Strict t1 Confirmation
Only the very next candle (t1) is checked:
Long
Short
Prevents rapid-fire entries in choppy markets.✅ Key Features
Strict 1-bar confirmation for cleaner entries.
Fast EMA filter to avoid false breakouts.
Cooldown system to reduce overtrading.
Visual markers for Key Bars and trade entries.
Fully customizable parameters (BB period, EMA length, cooldown bars).
📈 Best Suited For
Short-term scalping or intraday setups.
Catching quick reversals or momentum continuation.
Traders who need stricter signal validation to filter noise.

维加斯双通道策略Vegas Channel Comprehensive Strategy Description
Strategy Overview
A comprehensive trading strategy based on the Vegas Dual Channel indicator, supporting dynamic position sizing and fund management. The strategy employs a multi-signal fusion mechanism including classic price crossover signals, breakout signals, and retest signals, combined with trend filtering, RSI+MACD filtering, and volume filtering to ensure signal reliability.
Core Features
Dynamic Position Sizing: Continue adding positions on same-direction signals, close all positions on opposite signals
Smart Take Profit/Stop Loss: ATR-based dynamic TP/SL, updated with each new signal
Fund Management: Supports dynamic total amount management for compound growth
Time Filtering: Configurable trading time ranges
Risk Control: Maximum order limit to prevent over-leveraging
Leverage Usage Instructions
Important: This strategy does not use TradingView's margin functionality
Setup Method
Total Amount = Actual Funds × Leverage Multiplier
Example: Have 100U actual funds, want to use 10x leverage → Set total amount to 100 × 10 = 1000U
Trading Amount Calculation
Each trade percentage is calculated based on leveraged amount
Example: Set 10% → Actually trade 100U margin × 10x leverage = 1000U trading amount
Maximum Orders Configuration
Must be used in conjunction with leveraged amount
Example: 1000U total amount, 10% per trade, maximum 10 orders = maximum use of 1000U
Note: Do not exceed 100% of total amount to avoid over-leveraging
Parameter Configuration Recommendations
Leverage Configuration Examples
Actual funds 100U, 5x leverage, total amount setting 500U, 10% per trade, 50U per trade, recommended maximum orders 10
Actual funds 100U, 10x leverage, total amount setting 1000U, 10% per trade, 100U per trade, recommended maximum orders 10
Actual funds 100U, 20x leverage, total amount setting 2000U, 5% per trade, 100U per trade, recommended maximum orders 20
Risk Control
Conservative: 5-10x leverage, 10% per trade, maximum 5-8 orders
Aggressive: 10-20x leverage, 5-10% per trade, maximum 10-15 orders
Extreme: 20x+ leverage, 2-5% per trade, maximum 20+ orders
Strategy Advantages
Signal Reliability: Multiple filtering mechanisms reduce false signals
Capital Efficiency: Dynamic fund management for compound growth
Risk Controllable: Maximum order limits prevent liquidation
Flexible Configuration: Supports various leverage and fund allocation schemes
Time Control: Configurable trading hours to avoid high-risk periods
Usage Notes
Ensure total amount is set correctly (actual funds × leverage multiplier)
Maximum orders should not exceed the range allowed by total funds
Recommend starting with conservative configuration and gradually adjusting parameters
Regularly monitor strategy performance and adjust parameters timely
维加斯通道综合策略说明
策略概述
基于维加斯双通道指标的综合交易策略,支持动态加仓和资金管理。策略采用多信号融合机制,包括经典价穿信号、突破信号和回踩信号,结合趋势过滤、RSI+MACD过滤和成交量过滤,确保信号的可靠性。
核心功能
动态加仓:同向信号继续加仓,反向信号全部平仓
智能止盈止损:基于ATR的动态止盈止损,每次新信号更新
资金管理:支持动态总金额管理,实现复利增长
时间过滤:可设置交易时间范围
风险控制:最大订单数限制,防止过度加仓
杠杆使用说明
重要:本策略不使用TradingView的保证金功能
设置方法
总资金 = 实际资金 × 杠杆倍数
示例:实际有100U,想使用10倍杠杆 → 总资金设置为 100 × 10 = 1000U
交易金额计算
每笔交易百分比基于杠杆后的金额计算
示例:设置10% → 实际交易 100U保证金 × 10倍杠杆 = 1000U交易金额
最大订单数配置
必须配合杠杆后的金额使用
示例:1000U总资金,10%单笔,最大10单 = 最多使用1000U
注意:不要超过总资金的100%,避免过度杠杆
参数配置建议
杠杆配置示例
实际资金100U,5倍杠杆,总资金设置500U,单笔百分比10%,单笔金额50U,建议最大订单数10单
实际资金100U,10倍杠杆,总资金设置1000U,单笔百分比10%,单笔金额100U,建议最大订单数10单
实际资金100U,20倍杠杆,总资金设置2000U,单笔百分比5%,单笔金额100U,建议最大订单数20单
风险控制
保守型:5-10倍杠杆,10%单笔,最大5-8单
激进型:10-20倍杠杆,5-10%单笔,最大10-15单
极限型:20倍以上杠杆,2-5%单笔,最大20单以上
策略优势
信号可靠性:多重过滤机制,减少假信号
资金效率:动态资金管理,实现复利增长
风险可控:最大订单数限制,防止爆仓
灵活配置:支持多种杠杆和资金配置方案
时间控制:可设置交易时间,避开高风险时段
使用注意事项
确保总资金设置正确(实际资金×杠杆倍数)
最大订单数不要超过总资金允许的范围
建议从保守配置开始,逐步调整参数
定期监控策略表现,及时调整参数

Nirvana True Duel전략 이름
열반의 진검승부 (영문: Nirvana True Duel)
컨셉과 철학
“열반의 진검승부”는 시장 소음은 무시하고, 확실할 때만 진입하는 전략입니다.
EMA 리본으로 추세 방향을 확인하고, 볼린저 밴드 수축/확장으로 변동성 돌파를 포착하며, OBV로 거래량 확인을 통해 가짜 돌파를 필터링합니다.
전략 로직
매수 조건 (롱)
20EMA > 50EMA (상승 추세)
밴드폭 수축 후 확장 시작
종가가 상단 밴드 돌파
OBV 상승 흐름 유지
매도 조건 (숏)
20EMA < 50EMA (하락 추세)
밴드폭 수축 후 확장 시작
종가가 하단 밴드 이탈
OBV 하락 흐름 유지
진입·청산
손절: ATR × 1.5 배수
익절: 손절폭의 1.5~2배에서 부분 청산
시간 청산: 설정한 최대 보유 봉수 초과 시 강제 청산
장점
✅ 추세·변동성·거래량 3중 필터 → 노이즈 최소화
✅ 백테스트·알람 지원 → 기계적 매매 가능
✅ 5분/15분 차트에 적합 → 단타/스윙 트레이딩 활용 가능
주의점
⚠ 횡보장에서는 신호가 적거나 실패 가능
⚠ 수수료·슬리피지 고려 필요
📜 Nirvana True Duel — Strategy Description (English)
Name:
Nirvana True Duel (a.k.a. Nirvana Cross)
Concept & Philosophy
The “Nirvana True Duel” strategy focuses on trading only meaningful breakouts and avoiding unnecessary noise.
Nirvana: A calm, patient state — waiting for the right opportunity without emotional trading.
True Duel: When the signal appears, enter decisively and let the market reveal the outcome.
In short: “Ignore market noise, trade only high-probability breakouts.”
🧩 Strategy Components
Trend Filter (EMA Ribbon): Stay aligned with the main market trend.
Volatility Squeeze (Bollinger Band): Detect volatility contraction & expansion to catch explosive moves early.
Volume Confirmation (OBV): Filter out false breakouts by confirming with volume flow.
⚔️ Entry & Exit Conditions
Long Setup:
20 EMA > 50 EMA (uptrend)
BB width breaks out from recent squeeze
Close > Upper Bollinger Band
OBV shows positive flow
Short Setup:
20 EMA < 50 EMA (downtrend)
BB width breaks out from recent squeeze
Close < Lower Bollinger Band
OBV shows negative flow
Risk Management:
Stop Loss: ATR × 1.5 below/above entry
Take Profit: 1.5–2× stop distance, partial take-profit allowed
Time Stop: Automatically closes after max bars held (e.g. 8h on 5m chart)
✅ Strengths
Triple Filtering: Trend + Volatility + Volume → fewer false signals
Mechanical & Backtestable: Ideal for objective trading & performance validation
Adaptable: Works well on Bitcoin, Nasdaq futures, and other high-volatility markets (5m/15m)
⚠️ Things to Note
Low signal frequency or higher failure rate in sideways/range markets
Commission & slippage should be factored in, especially on lower timeframes
ATR multiplier and R:R ratio should be optimized per asset

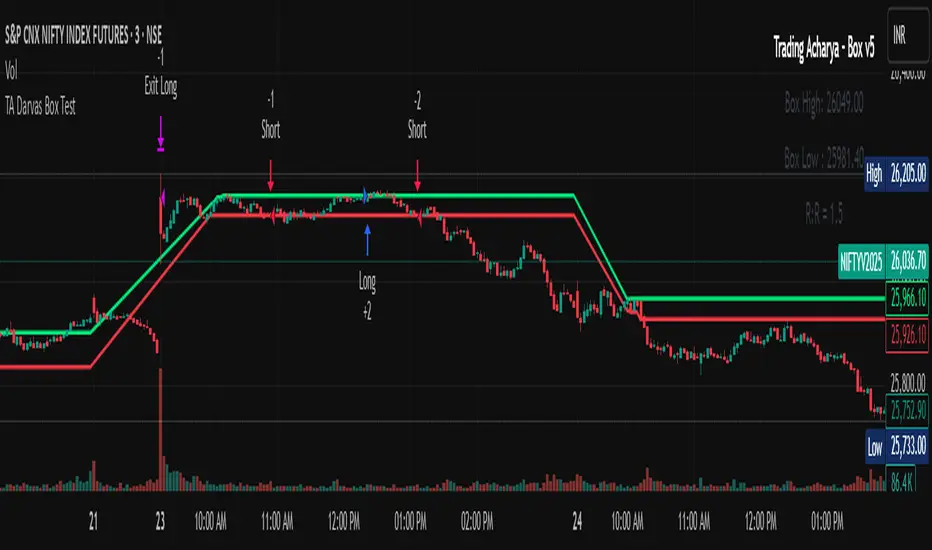
TA Darvas Box Test🎯 Core Logic
1-Darvas Box Breakouts/Breakdowns → Entry when price crosses above the Top Box (long) or below the Bottom Box (short).
2-Trend Filter (MavilimW) → Longs only when price is above MAVW, shorts only when below.
3-Momentum Confirmations → ATR spike and Volume spike must confirm breakout strength.
🛠 Position Sizing (MaTriangle – Martingale by Qty)
1-Starts with Base Qty.
2-On losing trades → step-up size using Qty Multiplier, capped by Max Steps & Max Qty Cap.
3-On winning trades → optional reset back to Base Qty.
⚠️ Martingale sizing can increase drawdowns — use carefully.
⏱ Trade Gating
1-Backtest Window: Only trades between selected From – To dates.
2-Trade Cap: Limit trades Per Day / Per Week / Per Month (auto reset).
3-One Position at a Time (pyramiding = 0).
📉 Exit Rules
1-Protective Stops:
2-Long → Stop at Bottom Box.
3-Short → Stop at Top Box.
Profit Safeguard: If in profit, exit when RVI crosses against trade.
1-No fixed TP → trades ride until Box stop or RVI exit.
🔔 Alerts (Options Workflow)
1-Static Alerts: Fire on confirmed long/short signals (compile-safe).
2-Dynamic Alerts: Send ATM strike info, Qty, and Martingale step.
3-Auto ATM Mapping: BANKNIFTY, NIFTY, FINNIFTY, MIDCPNIFTY detected automatically; fallback to manual step.
⚙️ Suggested Defaults
Darvas Box Length = 5
ATR Len = 14, ATR SMA = 14, Mult = 1.0–1.5
Volume SMA = 20, Mult = 1.5–2.0
Base Qty = 1, Mult = 2.0, Max Steps = 3
Trade Cap = Per Day, 10–30 trades
✅ Works on any symbol/timeframe.
⚠️ High-risk position sizing (Martingale). Backtest thoroughly and use with caution.
Inakis-BB-Stoch-ATR-ADX StrategyStrategy Description
This advanced trading strategy combines multiple technical indicators to identify high-probability breakout opportunities in trending markets. The system uses a multi-layered filtering approach to ensure only the strongest signals trigger trades.
Key Components:
Primary Signals:
Bollinger Bands Breakout: Identifies price extremes when price breaks below the lower band (buy) or above the upper band (sell)
Stochastic Oscillator: Confirms oversold (<30) and overbought (>70) conditions
ADX Filter: Ensures sufficient trend strength is present (ADX > 20)
ATR Volatility Filter: Trades only during periods of adequate volatility
Advanced Features:
DMI Higher Timeframe Analysis: Incorporates directional movement from higher timeframes (default 1H) to align trades with the dominant trend
Volume Confirmation: Requires above-average volume for signal validation
Cooldown Period: Prevents overtrading by enforcing minimum bars between signals
Visual Feedback: Color-coded background based on higher timeframe trend direction
Risk Management:
Fixed position sizing with customizable contract size
Predefined Stop Loss (default 500 points) and Take Profit (default 1000 points) levels
Clear risk-reward ratio of 1:2
Trading Logic:
Long Entry: Price breaks below BB lower band + Stochastic < 30 + Higher TF bullish trend
Short Entry: Price breaks above BB upper band + Stochastic > 70 + Higher TF bearish trend
All entries require confirmation from ADX, ATR, and volume filters
Customization:
All parameters are fully adjustable through the input panel, allowing traders to optimize the strategy for different markets and timeframes. Each filter can be individually enabled/disabled for testing and optimization purposes.
This strategy is designed for trending markets and performs best on liquid instruments with clear directional moves.

Hilly's 0010110 Reversal Scalping Strategy - 5 Min CandlesKey Features and Rationale:
Timeframe: Restricted to 5-minute candles as requested.
Pattern Integration: Includes single (Hammer, Shooting Star, Doji), two (Engulfing, Harami), and three-plus (Morning Star, Evening Star) candlestick patterns, plus reversal patterns based on RSI extremes.
VWAP Cross: Incorporates bullish (price crosses above VWAP) and bearish (price crosses below VWAP) signals, enhanced by trend context.
Volume Analysis: Uses a volume spike threshold to filter noise, with a simple day-start volume comparison for financial environment context.
Financial Environment: Approximates the day's sentiment using early-hour volume compared to current volume, adjusted by trend.
Aggregation: Scores each condition (e.g., 1 for basic patterns, 2 for strong patterns like Engulfing, 3 for three-candle patterns) and decides based on weighted consensus, with trendStrength as a tunable threshold.
Risky Approach: Minimal filtering and a low trendStrength (default 0.5) allow frequent signals, aligning with your $100-to-$200 goal, but expect higher risk.
Suggested Inputs:
EMA Length: 10 (short enough for 5-minute sensitivity).
VWAP Lookback: 1 (uses current session VWAP).
Volume Threshold Multiplier: 1.2 (moderate spike requirement).
RSI Length: 14 (standard, adjustable to 7 for more sensitivity).
Trend Strength Threshold: 0.5 (balance between signals; lower to 0.4 for more trades, raise to 0.6 for fewer).

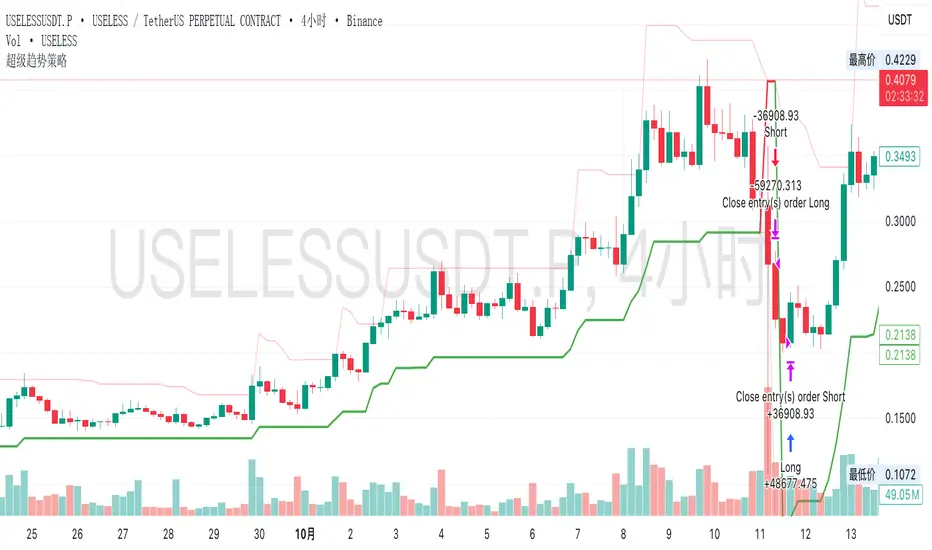
QZ Trend (Crypto Edition) v1.1a: Donchian, EMA, ATR, Liquidity/FThe "QZ Trend (Crypto Edition)" is a rules-based trend-following breakout strategy for crypto spot or perpetual contracts, focusing on following trends, prioritizing risk control, seeking small losses and big wins, and trading only when advantageous.
Key mechanisms include:
- Market filters: Screen favorable conditions via ADX (trend strength), dollar volume (liquidity), funding fee windows, session/weekend restrictions, and spot-long-only settings.
- Signals & entries: Based on price position relative to EMA and EMA trends, combined with breaking Donchian channel extremes (with ATR ratio confirmation), plus single-position rules and post-exit cooldowns.
- Position sizing: Calculate positions by fixed risk percentage; initial stop-loss is ATR-based, complying with exchange min/max lot requirements.
- Exits & risk management: Include initial stop-loss, trailing stop (tightens only), break-even rule (stop moves to entry when target floating profit is hit), time-based exit, and post-exit cooldowns.
- Pyramiding: Add positions only when profitable with favorable momentum, requiring ATR-based spacing; add size is a fraction of the base position, with layers sharing stop logic but having unique order IDs.
Charts display EMA, Donchian channels, current stop lines, and highlight low ADX, avoidable funding windows, and low-liquidity periods.
Recommend starting with 4H or 1D timeframes, with typical parameters varying by cycle. Liquidity settings differ by token; perpetuals should enable funding window filters, while spot requires "long-only" and matching fees. The strategy performs well in trends with quick stop-losses but faces whipsaws in ranges (filters mitigate but don’t eliminate noise). Share your symbol and timeframe for tailored parameters.

The Real Deal v3.0The Real Deal v3.0 blends multiple layers of market structure into a single adaptive framework. Using a Gaussian price channel as its backbone, it adds dynamic confirmation from EMA filters, cloud-style trend detection, and a proprietary “Secret Sauce” momentum engine. Flexible trade direction, optional TP/SL management, and configurable entry/exit triggers allow the strategy to adapt to changing conditions. The result is a system designed to identify high-probability trades while filtering out the noise—simple on the surface, but with deeper mechanics under the hood.

kaka 谈趋势The Exponential Moving Average (EMA) strategy is a popular technical analysis tool used in trading to smooth price data over a specific time period. The EMA gives more weight to recent prices, making it more responsive to recent price changes compared to the Simple Moving Average (SMA).
AI-JX Strategy### 🤖 Core Features
AI-JX v3.3 is an AI-powered comprehensive trading strategy system developed with PineScript v6, integrating multiple advanced technical analysis tools and machine learning algorithms.
### 📊 Main Functional Modules 1. AI Learning System
- Adaptive Parameter Optimization : Automatically learns and adjusts trading parameters
- Three Strategy Modes : Conservative (ranging markets), Aggressive (trending markets), Balanced (universal)
- Dynamic Weight Adjustment : Intelligently allocates weights to different strategies based on market conditions
- Learning Memory Mechanism : Records historical trading data for continuous strategy optimization 2. Technical Indicator System
- SuperTrend Indicator : ATR-based trend following system
- Heikin Ashi Smoothing : Reduces market noise for clearer trend signals
- Standard Deviation Channels : Multi-level support and resistance analysis
- Trend Distribution Profile : Visualizes price distribution and trend strength
- Multi-Timeframe Analysis : Comprehensive analysis across 5m, 15m, and 1h timeframes 3. Intelligent Signal Generation
- Traditional Signals : Classic buy/sell signals based on SuperTrend
- AI Smart Signals : Comprehensive scoring system combining RSI, MACD, and ATR
- False Breakout Detection : Identifies and filters fake breakout signals
- Price Confirmation Mechanism : Ensures signal validity and reliability 4. Risk Management System
- Dynamic Stop Loss/Take Profit : Long 3% TP/1.5% SL, Short 2:1 risk-reward ratio
- Slippage Monitoring : Real-time market slippage risk assessment
- Volatility Filtering : Adjusts trading strategy based on ATR
- Position Management : Smart capital allocation and risk control 5. Visualization Panels
- Statistics Panel : Displays key data like trade count, win rate, current strategy
- AI Learning Panel : Shows strategy weights and learning progress
- Prediction Panel : Real-time AI analysis and trading recommendations
- Chart Markers : Clear buy/sell signals and trend line displays 6. Alert System
- Multiple Alert Types : Buy, sell, take profit, and stop loss notifications
- Personalized Messages : Fun "WangWang" themed alert messages
- Real-time Notifications : Precise alerts with maximum one per bar frequency
### 🎯 Key Advantages
- AI-Driven : Machine learning optimization for better performance
- Multi-Strategy : Adapts to different market conditions automatically
- Risk-Controlled : Comprehensive risk management with dynamic adjustments
- User-Friendly : Intuitive interface with detailed visualization panels
- Highly Customizable : Extensive parameter settings for different trading styles
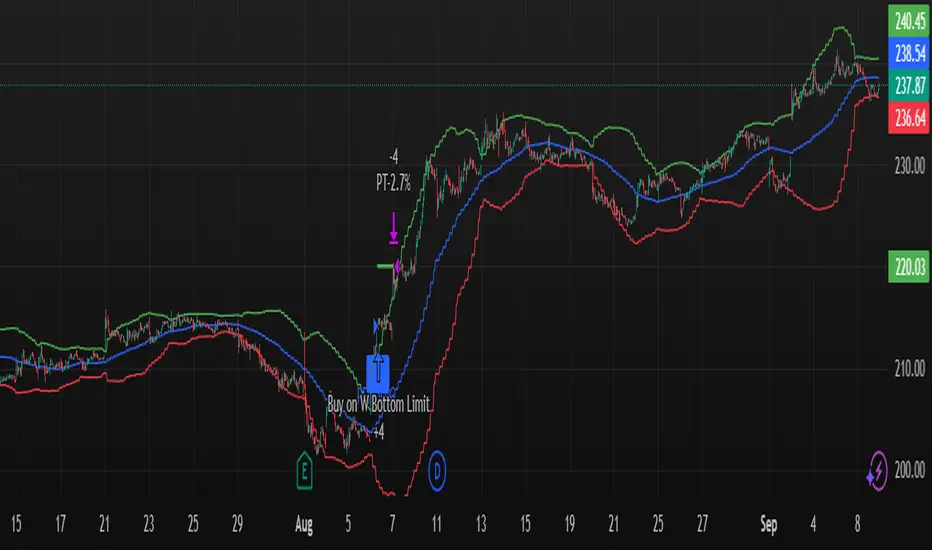
W Bottom Reversal Strategy W Bottom Reversal Strategy (15m-close entries; intrabar TP; daily MACD exit; JSON alerts v49.3-expire2)
Overview
A precision reversal strategy designed for 15-minute charts on liquid symbols. It detects a capitulation-and-stabilization “W” base using 1-hour (1H) context, confirms momentum improvement, then enters only on bar close to avoid early/“ghost” signals. Exits combine a fast intrabar take-profit (~2.7%) with a daily MACD risk-off exit that closes positions when higher-timeframe momentum turns against the setup.
How it works (high-level, matching code)
1H volatility + oversold gate (arming)
Compute 1H Bollinger-style bands (basis = SMA(close, bbLength=20), stdev multiplier bbMult=2.0).
Arm the setup when a 1H bar closes with price < 1H lower band and 1H RSI( rsiLength=14 ) < rsiThreshold (default 20.0).
1H momentum flip → pending entry
When a new 1H bar closes and 1H MACD line (EMA12−EMA26) crosses above 0 while armed and flat, set an entryPending flag.
This does not enter yet—it prepares a confirmed, bar-close entry on the lower timeframe.
Bar-close execution on the chart timeframe (15m)
On the next 15m bar close (or within N bars, see below) and still flat, fire the entry using a limit order at close × (1 − 0.00001) (≈ 0.001% below close) to reduce slippage and maintain chart/alert alignment.
Anti-late filter (no stale triggers)
If the pending entry doesn’t trigger within N chart bars (input: “Pending entry valid for N chart bars”, default 1, range 1–8), it expires and the arm state resets. This prevents late fills long after the 1H confirmation.
Exit logic
Primary: Standing intrabar take-profit at +2.7% from the average entry price (managed via strategy.exit limit).
Risk-off: On daily bar close, if Daily MACD line (EMA12−EMA26) crosses under 0, close the position (flat on daily momentum flip).
Default Properties (used for this publication)
Timeframe: 15m (with 1H and Daily higher-timeframe confirmations via request.security)
Initial capital: $10,000
Position sizing: Percent of equity = 10% per trade (enters only when flat; no stacking while in a position)
Commission: 0.05% per side
Slippage: Recommend 1 tick in Strategy Properties for realistic fills
Inputs exposed:
BB Length: 20 • BB Multiplier: 2.0
RSI Length: 14 • RSI Threshold: 20.0
MACD: Short 12, Long 26, Signal 9 (signal kept for compatibility; logic uses MACD line vs 0)
Pending entry valid for N chart bars: default 1 (1–8)
Execution behavior (per code):
calc_on_every_tick = false (evaluates on bar close)
process_orders_on_close = true (orders placed at bar close)
Limit entry at close −0.001%
Intrabar TP (2.7%)
Daily risk-off exit on MACD<0 at daily bar close
Alerts (exact behavior in code)
Uses alert() function calls with standardized JSON.
Set your alert to “Only alert() function calls” and “Once per bar close.”
Two events are emitted:
LONG_CONFIRMED on entry fire (15m bar close)
EXIT_CONFIRMED_DAILY_MACD on daily MACD<0 (daily bar close)
JSON fields include: event, version ("v49.3-expire2"), symbol, interval, price, and time.
How to use
Apply on liquid tickers (tight spreads, healthy volume).
Keep defaults initially; run across a broad, liquid watchlist to gather a proper sample.
For automation, route bar-close alerts to your executor; confirm broker lot/route settings and that limit orders at close −0.001% are acceptable.
Expect fewer signals in powerful trends; the daily risk-off helps cut failed bases.
Methodology & expectations (results transparency)
Evaluate on a dataset yielding 100+ trades before drawing conclusions.
Keep commission & slippage enabled (see defaults).
Risk sizing: With 10% of equity per trade and flat-to-flat entries, exposure aligns with typical 5–10% guidance.
No performance guarantees—outcomes depend on symbol selection, volatility regime, news, and execution quality.
Originality & value (vendor justification)
While it uses familiar building blocks (BB/RSI/MACD), the edge comes from the 1H volatility + oversold arming, 1H momentum flip, strict 15m bar-close limit execution, and the N-bar pending expiry that prevents stale triggers—paired with a dual-exit design (intrabar TP + daily risk-off). The focus is on reducing premature fills, keeping alerts 1:1 with chart marks, and capturing the first impulse out of a W-base.
Disclaimers
For educational purposes only; not financial advice. Paper-test first. Verify alerts, fills, and symbol liquidity with your broker before live use.
Changelog: v49.3-expire2 — Bar-close limit entries; anti-late pending window; standardized JSON alerts; intrabar 2.7% TP; daily MACD risk-off exit.
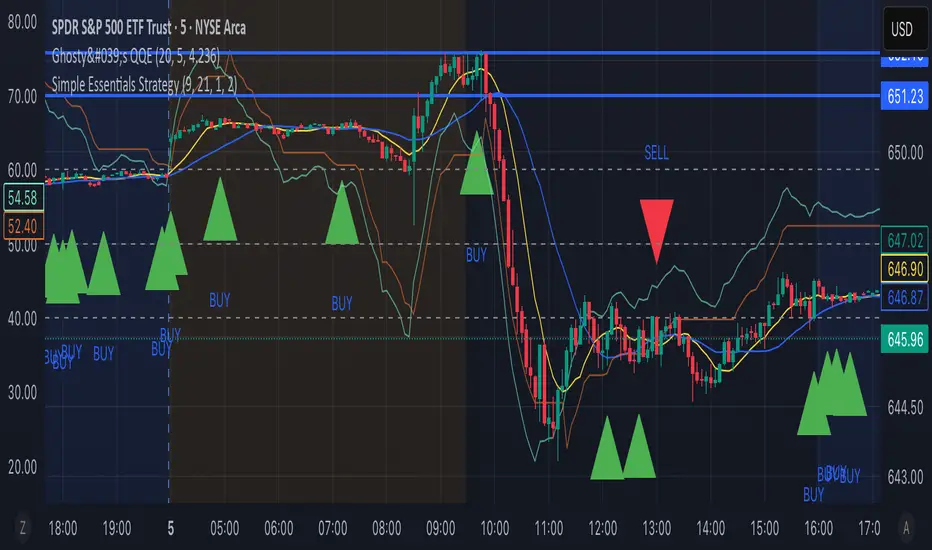
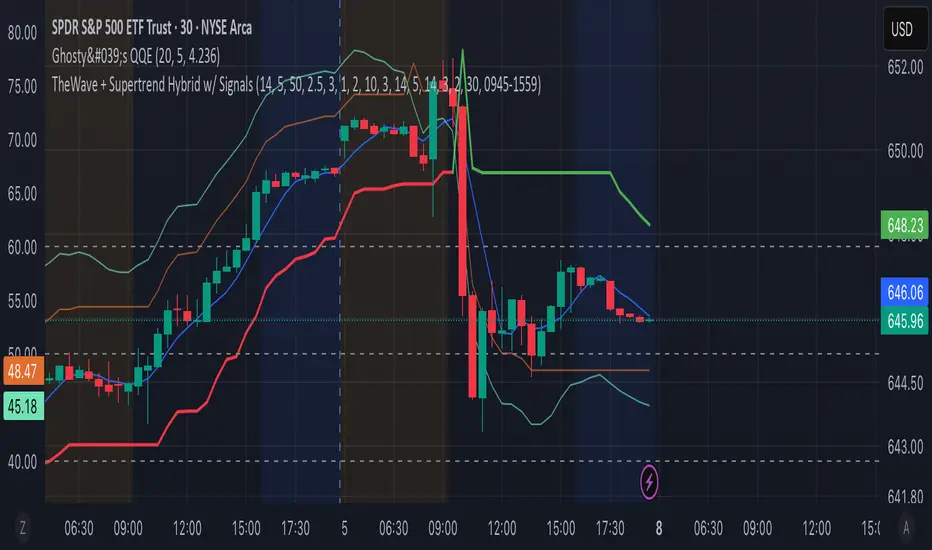
TheWave + Supertrend Hybrid w/ Signals• Green triangle below bar → Long entry signal
• Red triangle above bar → Short entry signal
• Small lime cross above/below → Take-profit hit
• Small maroon cross above/below → Stop-loss hit
• SMA5 and Supertrend lines for trend context
This version makes all entries and exits visually obvious while keeping the hybrid TheWave + Supertrend logic intact.
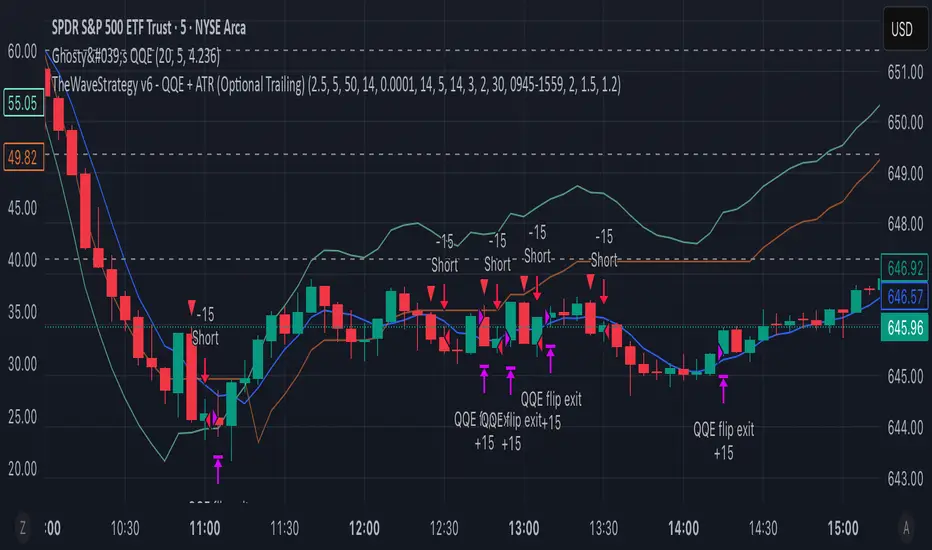
TheWaveStrategy v6 - QQE + ATR (Optional Trailing)New Version Of the wave with QQE and ATR
• Compiles cleanly in Pine v6.
• Optional trailing stop toggle via useTrailingATR.
• Market exit uses strategy.close() properly.
• ATR spike filter uses 5m ATR.
• QQE confluence with 30m timeframe included.
Hilly's Advanced Crypto Scalping Strategy - 5 Min ChartTo determine the "best" input parameters for the Advanced Crypto Scalping Strategy on a 5-minute chart, we need to consider the goals of optimizing for profitability, minimizing false signals, and adapting to the volatile nature of cryptocurrencies. The default parameters in the script are a starting point, but the optimal values depend on the specific cryptocurrency pair, market conditions, and your risk tolerance. Below, I'll provide recommended input values based on common practices in crypto scalping, along with reasoning for each parameter. I’ll also suggest how to fine-tune them using TradingView’s backtesting and optimization tools.
Recommended Input Parameters
These values are tailored for a 5-minute chart for liquid cryptocurrencies like BTC/USD or ETH/USD on exchanges like Binance or Coinbase. They aim to balance signal frequency and accuracy for day trading.
Fast EMA Length (emaFastLen): 9
Reasoning: A 9-period EMA is commonly used in scalping to capture short-term price movements while remaining sensitive to recent price action. It reacts faster than the default 10, aligning with the 5-minute timeframe.
Slow EMA Length (emaSlowLen): 21
Reasoning: A 21-period EMA provides a good balance for identifying the broader trend on a 5-minute chart. It’s slightly longer than the default 20 to reduce noise while confirming the trend direction.
RSI Length (rsiLen): 14
Reasoning: The default 14-period RSI is a standard choice for momentum analysis. It works well for detecting overbought/oversold conditions without being too sensitive on short timeframes.
RSI Overbought (rsiOverbought): 75
Reasoning: Raising the overbought threshold to 75 (from 70) reduces false sell signals in strong bullish trends, which are common in crypto markets.
RSI Oversold (rsiOversold): 25
Reasoning: Lowering the oversold threshold to 25 (from 30) filters out weaker buy signals, ensuring entries occur during stronger reversals.
MACD Fast Length (macdFast): 12
Reasoning: The default 12-period fast EMA for MACD is effective for capturing short-term momentum shifts in crypto, aligning with scalping goals.
MACD Slow Length (macdSlow): 26
Reasoning: The default 26-period slow EMA is a standard setting that works well for confirming momentum trends without lagging too much.
MACD Signal Smoothing (macdSignal): 9
Reasoning: The default 9-period signal line is widely used and provides a good balance for smoothing MACD crossovers on a 5-minute chart.
Bollinger Bands Length (bbLen): 20
Reasoning: The default 20-period Bollinger Bands are effective for identifying volatility breakouts, which are key for scalping in crypto markets.
Bollinger Bands Multiplier (bbMult): 2.0
Reasoning: A 2.0 multiplier is standard and captures most price action within the bands. Increasing it to 2.5 could reduce signals but improve accuracy in highly volatile markets.
Stop Loss % (slPerc): 0.8%
Reasoning: A tighter stop loss of 0.8% (from 1.0%) suits the high volatility of crypto, helping to limit losses on false breakouts while keeping risk manageable.
Take Profit % (tpPerc): 1.5%
Reasoning: A 1.5% take-profit target (from 2.0%) aligns with scalping’s goal of capturing small, frequent gains. Crypto markets often see quick reversals, so a smaller target increases the likelihood of hitting profits.
Use Candlestick Patterns (useCandlePatterns): True
Reasoning: Enabling candlestick patterns (e.g., engulfing, hammer) adds confirmation to signals, reducing false entries in choppy markets.
Use Volume Filter (useVolumeFilter): True
Reasoning: The volume filter ensures signals occur during high-volume breakouts, which are more likely to sustain in crypto markets.
Signal Arrow Size (signalSize): 2.0
Reasoning: Increasing the arrow size to 2.0 (from 1.5) makes buy/sell signals more visible on the chart, especially on smaller screens or volatile price action.
Background Highlight Transparency (bgTransparency): 85
Reasoning: A slightly higher transparency (85 from 80) keeps the background highlights subtle but visible, avoiding chart clutter.
How to Apply These Parameters
Copy the Script: Use the Pine Script provided in the previous response.
Paste in TradingView: Open TradingView, go to the Pine Editor, paste the code, and click "Add to Chart."
Set Parameters: In the strategy settings, manually input the recommended values above or adjust them via the input fields.
Test on a 5-Minute Chart: Apply the strategy to a liquid crypto pair (e.g., BTC/USDT, ETH/USDT) on a 5-minute chart.
Fine-Tuning for Optimal Performance
To find the absolute best parameters for your specific trading pair and market conditions, use TradingView’s Strategy Tester and optimization features:
Backtesting:
Run the strategy on historical data for your chosen pair (e.g., BTC/USDT on Binance).
Check metrics like Net Profit, Profit Factor, Win Rate, and Max Drawdown in the Strategy Tester.
Focus on a sample period of at least 1–3 months to capture various market conditions (bull, bear, sideways).
Parameter Optimization:
In the Strategy Tester, click the settings gear next to the strategy name.
Enable optimization for key inputs like emaFastLen (test range: 7–12), emaSlowLen (15–25), slPerc (0.5–1.5), and tpPerc (1.0–3.0).
Run the optimization to find the combination with the highest net profit or best Sharpe ratio, but avoid over-optimization (curve-fitting) by testing on out-of-sample data.
Market-Specific Adjustments:
Volatile Pairs (e.g., DOGE/USDT): Use tighter stop losses (e.g., 0.5–0.7%) and smaller take-profit targets (e.g., 1.0–1.2%) to account for rapid price swings.
Stable Pairs (e.g., BTC/USDT): Slightly wider stop losses (e.g., 1.0–1.2%) and take-profit targets (e.g., 1.8–2.5%) may work better.
Trending Markets: Increase emaSlowLen (e.g., to 25–30) to follow stronger trends.
Choppy Markets: Tighten bbMult (e.g., to 1.8) and lower rsiOverbought/rsiOversold (e.g., to 70/30) to filter noise.
Forward Testing:
After backtesting, run the strategy in real-time on a demo account for 1–2 weeks to validate performance under current market conditions.
Important Notes
No Universal "Best" Numbers: Optimal parameters vary by crypto pair, exchange, and market conditions (e.g., bull vs. bear market). The suggested values are a starting point based on common scalping practices.
Risk Management: Never risk more than 1–2% of your account per trade. Adjust position sizing in TradingView’s strategy settings to align with your risk tolerance.
Market Volatility: Crypto markets are highly volatile. Test the strategy on your specific pair and adjust parameters if signals are too frequent or too rare.
Not Financial Advice: This is an educational tool. Backtest thoroughly and use a demo account before trading with real funds.
If you want me to generate a chart showing backtest performance for specific parameters or to tweak the script further (e.g., adding more indicators or adjusting signal logic), let me know!can you add clear buy ans sell signs above the candles in this codeTo add clear buy and sell signals above the candles in the provided Pine Script, I'll modify the existing code to include prominent text labels directly above (for sell signals) and below (for buy signals) the candles. These labels will be larger, color-coded, and positioned to avoid clutter, ensuring they are easily visible on the chart. The core strategy logic (EMA, RSI, MACD, Bollinger Bands, candlestick patterns, and volume filter) will remain unchanged, and I'll reuse the same artifact_id since this is an update to the previous script.AdvancedCryptoScalpingStrategy.pinex-pine

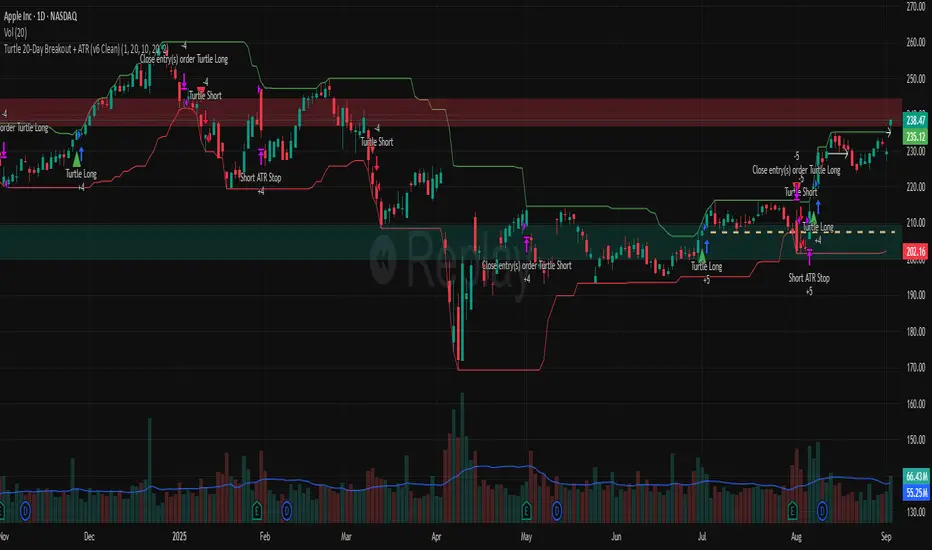
Turtle 20-Day Breakout + ATR (v6 Clean)20-bar breakout entries
ATR protective stops
Classic 10-bar opposite breakout exits
Proper plotting of breakout levels and stops
Signals on chart
Alert conditions in global scop
dabilThe strategy is probably to go short or long with the trend depending on the case, but if all time units 1 minute then 3 minutes then 5 minutes then 15 minutes then 1 hour all show the same direction, but first the 1 hour must be bullish in which the 1 hour candle closes above the previous one, for example if the trend is bearish then the market wants to change direction, then a 1 hour bullish close must then be followed by a 1 hour bearish close below the bullish candle, then another bullish candle must shoot above the previous bullish candle, then 15 minutes also shoot above the previous 15 bullish candles, then 1 and 2...3.5. Then I can rise with the market by only covering the last 15 bullish candles with my stop loss, if my SL is 50 pips then I want 100 pips and then I'm out.

My Backtest Module### 📊 Universal Backtest Module - Pro Structure
**A Fully Customizable Strategy Framework for Advanced Backtesting & Signal Analysis**
This powerful Pine Script strategy is designed as a **universal testing module** for traders and developers who want to evaluate custom trading logic across multiple conditions, timeframes, and risk parameters — all within a single, flexible structure.
> ⚠️ **Note:** This script is intended for **educational and backtesting purposes only**. It does **not** provide financial advice, nor does it guarantee profits. Always test strategies thoroughly before applying them to live markets.
---
### 🔧 Key Features
✅ **Multi-Source Entry Signals**
Combine up to two independent buy/sell signals using flexible logic:
- **OR Logic**: Trigger on any signal (edge-based).
- **AND Logic (Latched)**: Requires both signals at any point (flip-flop style).
- **AND No Latch**: Both signals must be active simultaneously.
✅ **Dynamic Trade Direction Control**
Choose between:
- Long & Short (Both)
- Long Only
- Short Only
With optional **close-on-opposite-signal** and **wait-for-opposite-reentry** logic.
✅ **Precision Timing Filters**
- Date range filtering (start/end dates)
- Intraday session control (supports up to 3 custom sessions)
- Visual session shading for clarity
✅ **Advanced Risk Management**
- Multiple Stop Loss types:
- Fixed Points / Percent
- ATR-based (adjustable multiplier)
- Swing-based (automatically detects pivots)
- External SL source
- Dynamic position sizing:
- Fixed lot
- % of equity risk (with max fallback)
✅ **Smart Take Profit Options**
- Fixed Points, Percent, RR Ratio, ATR, Fibonacci extensions
- Support for **external TP levels** (user-defined sources)
- Optional **multiple partial exits** with customizable size distribution
- Fibonacci TP levels (1.0, 1.618, 2.618, 4.236) based on SL distance
✅ **Flexible Exit Tools**
- Breakeven stop activation after TP1 hit
- Internal swing-based trailing stop
- External trailing stop (custom source)
- Max holding time (auto-close after X candles)
- Custom close conditions via user-defined logic
- Close & reverse functionality
✅ **Visual Clarity & Feedback**
- Clear visual markers for Buy/Sell signals
- Real-time SL, Entry, and TP lines with color-coded risk/reward zones
- On-chart TP level labels showing prices and allocation percentages
- Session background highlighting
- Trade statistics summary label
---
### 🛠️ Ideal For:
- Testing new indicator combinations
- Validating entry/exit logic under various market filters
- Comparing signal fusion methods (OR vs AND)
- Simulating professional-grade risk management rules
- Educational demonstrations in algorithmic trading
---
### ⚠️ Important Notes
- This is a **backtesting tool**, not a live trading bot.
- Past performance is **not indicative of future results**.
- Strategy performance depends entirely on the quality of input signals.
- Always validate results across multiple assets and timeframes.
- Use in conjunction with sound money management principles.
---
### 📌 How to Use
1. Attach the script to your chart.
2. Configure **Buy/Sell Signal Sources** (e.g., RSI crossovers, moving averages, etc.)
3. Set your preferred **trade direction, session, and date filters**
4. Define **stop loss and take profit rules**
5. Adjust position sizing and exit behavior
6. Run the backtest and analyze results in the **Strategy Tester tab**
💡 *Tip: Combine with other indicators by referencing their output values as signal sources.*
---
### ❌ Disclaimer
This script is shared for **informational and educational purposes only**. By using it, you agree that:
- The author is **not responsible** for any financial losses.
- Trading involves significant risk; only risk capital should be used.
- You are solely responsible for your trading decisions.
🚫 **This script does not promote get-rich-quick schemes, guaranteed profits, or unverified performance claims.**
---
🔁 **Version:** 5 (Pine Script v5)
📦 **Category:** Strategy
📈 **Overlay:** Yes
🧪 **Purpose:** Backtesting, Signal Validation, Risk Modeling
---
✅ **Safe for Public Sharing**
✔ Complies with TradingView’s community standards
✔ No misleading performance claims
✔ No automated trading promises
✔ No copyrighted or plagiarized content
---
> 💬 *"Knowledge is power — test wisely, trade responsibly."*
---
Let me know if you'd like a **short version** for the script's header comment or a **public post summary** for the TradingView feed!
EMA MACD - 5-20Based on Crossover and Big timeframe EMA Support and resistance this strategy is developed.

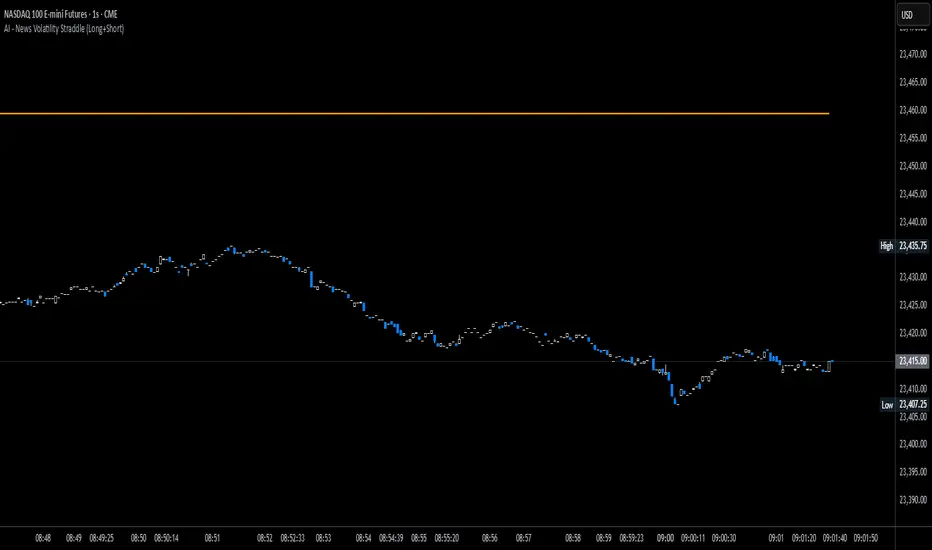
News Volatility Bracketing StrategyThis is a news-volatility bracketing strategy. Five seconds before a scheduled release, the strategy brackets price with a buy-stop above and a sell-stop below (OCO), then converts the untouched side into nothing while the filled side runs with a 1:1 TP/SL set the same distance from entry. Distances are configurable in USD or %, so it scales to the instrument and can run on 1-second data (or higher TF with bar-magnifier). The edge it’s trying to capture is the immediate, one-directional burst and liquidity vacuum that often follows market-moving news—entering on momentum rather than predicting direction. Primary risks are slippage/spread widening and whipsaws right after the print, which can trigger an entry then snap back to the stop.
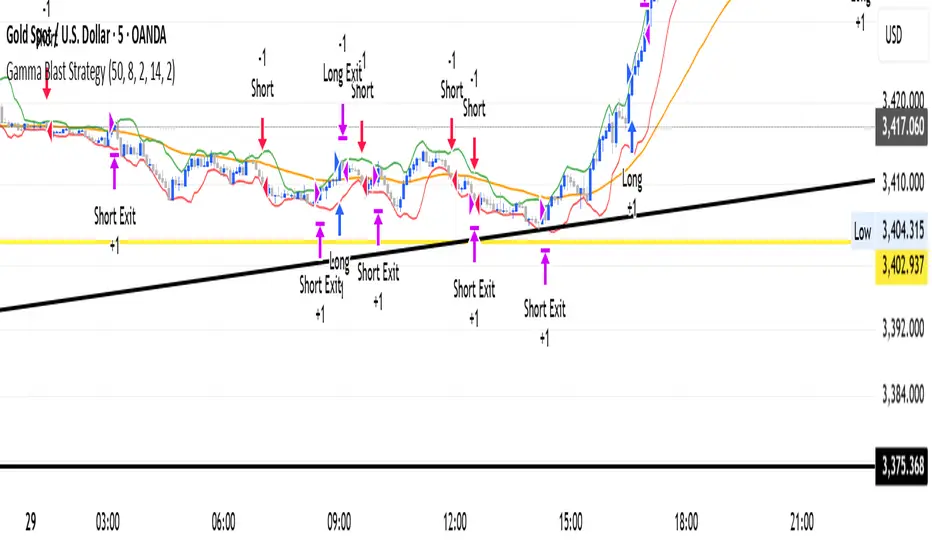
Gamma Blast StrategyGamma Blast Strategy used for quick 2-5 ticks on Buys, but on a sideways market can get up to 15-20 ticks.