Trend Catcher - Divergences v2 - by Crypto_Dan_CroIf you want to get this indicator, contact me on
X handle: @crypto_dan_cro
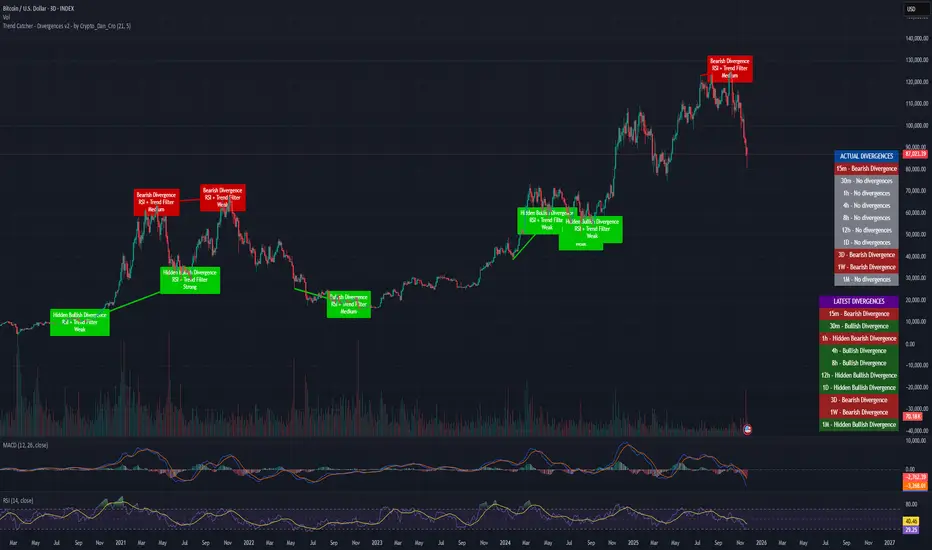
What is Trend Catcher - Divergences v2?
It's advanced TradingView indicator designed to automatically detect and visualize divergences between price action and the RSI indicator, enhanced with smart filtering and visual strength analysis.
This tool helps traders identify potential trend reversals, continuation opportunities, and areas of weakening momentum with high clarity and precision.
Key Features
Automatic Detection of Divergences:
- Bullish divergence
- Bearish divergence
- Hidden bullish divergence
- Hidden bearish divergence
Overlap Prevention System
When bullish and bearish divergences occur in the same zone, the script intelligently prioritizes the stronger and more reliable signal to avoid confusion and clutter.
Visual Chart Rendering
Each divergence is displayed with:
- A line connecting key swing points
- A label showing: Divergence type, Active confirmation filter, Signal strength (Weak / Medium / Strong / Extreme)
Divergence Strength Heatmap
The indicator includes a Heatmap system that visually represents divergence strength using color intensity:
- Weak divergences appear lighter and more transparent
- Strong divergences appear bold and highly visible
Strength Classification Levels
Every divergence is categorized into one of four levels: Weak, Medium, Strong, Extreme
Confirmation Filters
- RSI + Trend Filter (recommended)
- RSI + MACD
- RSI + OBV
- MACD + Price Action
Multi-Timeframe Information Panels
ACTUAL DIVERGENCES
Displays currently active divergences across timeframes
LATEST DIVERGENCES
Shows the most recent divergence detected on each timeframe
Included timeframes:
15m, 30m, 1h, 4h, 8h, 12h, 1D, 3D, 1W, 1M
Ideal Use Cases
This indicator is perfect for:
- Swing trading
- Identifying reversal zones
- Momentum exhaustion detection
- Supporting price action strategies
- Trend confirmation and filtering
Trend Catcher – Divergences v2 provides a powerful yet clear approach to divergence trading by combining:
- Smart logic
- Visual clarity
- Strenght analysis
- Reliable filtering
It is built for traders who want precision, clarity, and confidence when trading divergences.
Crypto markets are volatile, if you choose to use this indicator for trading, you are doing it on your own. Crypto_dan_cro is not responsible for any profits or losses created by using this Indicator.
Breakdowntrading
BANKNIFTY position screenerThe script takes present day's price range of the stocks (stocks of the Index being tracked included in this screener) into account, to hint strength or weakness in the underlying Index (for example: BANKNIFTY here). The day's price range of a stock is gauged on a scale of 0-100, where 0 is Day's price low and 100 is day's price high.
If a stock is in 90-100 price range section the cell with title "90" illuminates hinting the stock is trading near day's high.
Likewise, if a stock is in 0-10 price range section the cell with title "10" illuminates hinting that the stock is trading near day's low.
The price range of 10-25 is represented in the cell titled "25"
The price range of 75-90 is represented in the cell titled "75"
Only one cell from the day's range illuminates at a time for a stock, signaling the present position of that stock in the Day's range at that instant.
The script works best above 10 second time frame.
Idea: If majority of the heavy weight stocks of the Index being tracked are trading near Day's high the underlying Index must be going strong at that very instant and Vice versa.
Disclaimer: Only for studying Index movement ideas intraday, trading is not advised.

Traffic Light Signal - POSTraffic Light Signal (TLS) is simple and most easy setup to trade.
How The Traffic Light Signal Works ?
First You have to find a Green and red candle pair or red and green candle pair then mark there highest high and lowest low with the help of line tool. if High breaks go for Buy and when low breaks go Sell. Avoid Doji candle Pair to get better result.
Additonal Indicator Used :
Relative Strength Index : To find Overbought and Oversold Zones
How to Take trade with The help of TLS indicator :
The Indicator detects the Pair candle and detect whether the pair bar high or low cross over or cross under and display the signal over the chart.
if Triangle UP Shape Appears on chart , Once the high of the signal candle breaks take entry for buy side StopLoss will be low of the signal candle.
if Triangle Down Shape Appears on chart, once the low of the signal candle breaks take entry for Short side StopLoss will be low of the signal Candle.
Always Try to take profit 1:2 or as per your risk rewards.
Note :
if you are scalping then avoid first and Last Bar of day in 1 min and 3 min timeframe only
if you are Intraday Trader Use 5 Min and 15 Min max for this strategy.
if your are positional Trader use 1hr or 1 day Timeframe to trade.
No more than 3 trades to trade on this indicator.
Use Additional Indicator for Accuracy
Indicator works on Crypto , Equity , Futures , Options.
Hope you like this if any issue with this indicator ask below or message me.
Thanks and Regards,
TradingTail

Opening Range & Daily and Weekly PivotsThis script is for a combination of two indicators: an Opening Range Breakout (ORB) indicator and a daily/weekly high/low pivot indicator. The ORB indicator displays the opening range (the high and low of the first X minutes of the trading day, where X is a user-defined parameter) as two lines on the chart. If the price closes above the ORB high, the script triggers an alert with the message "Price has broken above the opening range." Similarly, if the price closes below the ORB low, the script triggers an alert with the message "Price has broken below the opening range."
The daily/weekly high/low pivot indicator plots the previous day's high and low as well as the previous week's high and low. If the current price closes above yesterday's high or last week's high, the script triggers an alert with the messages "We are now trading higher than the previous daily high" and "We are now trading higher than the last week high", respectively. If the current price closes below yesterday's low or last week's low, the script triggers an alert with the messages "We are now trading lower than the previous daily low" and "We are now trading lower than the last week low", respectively.
In addition to the visual representation on the chart, the script also triggers alerts when the price crosses any of these levels. These alerts are intended to help traders make decisions about entering or exiting trades based on the price action relative to key levels of support and resistance.

Opening Range Breakout (and price targets)This Opening Range Breakout indicator stands apart from others for several reasons. Apart from displaying the opening range high and low on a chart, the script also plots customized potential price targets ( different from any other on TradingView! ) for breakouts and breakdowns in price action. These customized targets can be toggled on and off in the input section of the indicator's settings.
With regard to the indicator itself, it has two other key inputs, the "ORB total time (minutes)" and "ORB Timeframe". The first input sets the maximum number of minutes to be used in the calculation of the opening range, and the second input sets the specific time frame when the opening range is calculated. The script plots the opening range high and low on the chart as two separate lines with the high in blue and the low in white, and these lines dynamically change color of the high to green and the low to red if the current price is above or below the opening range, respectively.
The script starts by calculating whether or not the current bar falls within the specified time frame. It then sets the initial values of the opening range high and low, and continuously updates these values if the current bar's high or low is higher or lower than the previous values, respectively. The updated values are then plotted on the chart with the specified style and color.
Traders may use the ORB Indicator to trade breakouts and breakdowns of the opening range. If the price breaks above the opening range high, traders may look to enter long positions, and if the price breaks below the opening range low, traders may look to enter short positions. The customized price targets may be consulted for potential areas to take profit. The color change of the high and low lines can provide additional confirmation of a potential breakout or breakdown, adding to the strength of the trade setup. It is important to note that the ORB Indicator does not guarantee success, and traders should always consider other technical and fundamental factors before entering a trade.
Users can also create alerts for when price breaks above or below the opening range. This will provide up-to-date live alerts for traders who cannot be staring at their screens all day long.

Volume Bar Breakout and Breakdown IndicatorVolume shows strength of a movement and highest volume shows the region that pushed price to certain extent with full strength. Breakout or Breakout of the highest volume bar range shows continuity further push by sellers or buyers indicating a trend continuation for a small period if not for long duration. Entries can be taken once signal is generated with stoploss as recommended.
Guidelines:
Don't trade if range is too large
Don't trade if Breakdown or Breakdown candle body / range is too large or if there is high volatility
Use additional indicator to get the idea of overall trend analysis

Box Range AlertSimple Script for getting alerts on the crossing of Upper & Lower levels either way.
Good for Free users as they can only use 1 alert at a time. So this indicator will be useful to get alerts on both Breakout Or Breakdowns.
Just add input Price manually and set alerts.

52 Week High/Low to YesterdayThis script adds the 52 weeks (one year) high/low to the chart but it wouldn't update the value on the current trading day, so that it would remain at the same level for the whole trading day. It can come really handy for day trading the day of the 52 weeks high/low breakout/breakdown.
