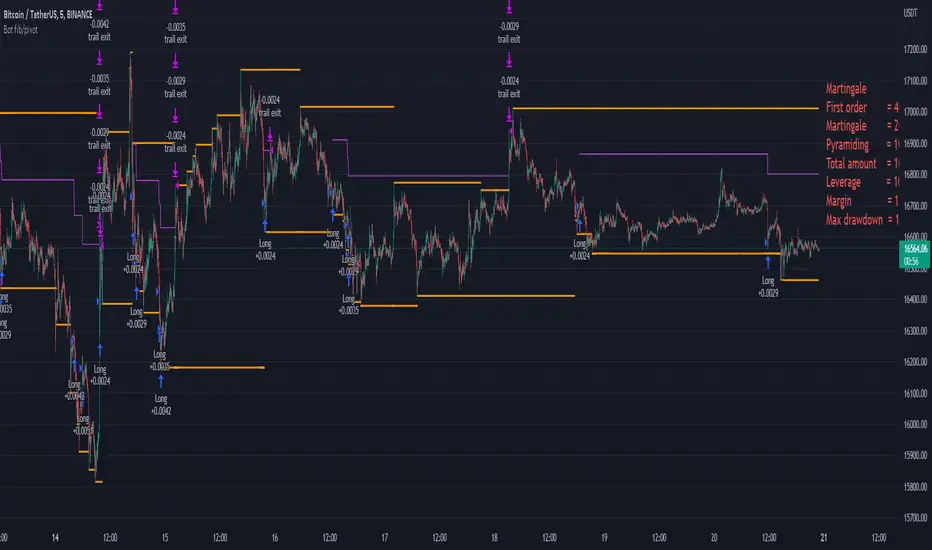
Bot fib/pivot Hello, friends!
This strategy is based on the fibonacci level you choose in the setup and possible pivot points under the control of Williams’ Percent Range.
Williams' Percent Range is a dynamic indicator that detects overbought/oversold conditions.
When the possible reversal points coincide with the fibonacci level, and the high or low points according to Williams also coincide, then an entry occurs.
One of the oldest and most reliable trading tools are widely used support and resistance levels.
In this strategy, we are trying to find these reversal levels based on fibonacci.
//LOGIC ENTRY SETTINGS
Deviation-deviation from the pivot point, the lower this figure, the more entries. The yellow lines on the chart are pivot points.
Fibonacci lvl-fibonacci level, from which the entry will occur, provided that other conditions match
Highest lookback-The setting, which refers to Williams' Percent Range , looks at how many candles ago, was high or low. The smaller the number, the larger, but less accurate inputs.
//AMOUNT(USDT) FIRST ORDER AND > % NEXT
-Martingale first order (the amount of the entrance to the usdt) / next order (Increase of each subsequent order as a percentage)
//EXIT SETTINGS (%, RSI)
-Use RSI for close position? (the position will not be closed if it is in the red, even if the RSI conditions worked)
-Use % for exit? Exit immediately upon reaching the specified percentage
-Use trailing? When the checkbox is checked, the position will be exited by trailing.
Activation trail,after?- When the specified percentage is reached, trailing is activated!
Stop_trail,%- if the last candle falls from the high (after the trailing is activated), the position will be exited.
For example:
We entered the purchase at 100 per asset, activation costs 10, and stop is 2.
the price reached 110, there was an activation, after that it went up to 120, and from the high of the last candle, a 2% drop occurs and the trade is exited.
PS:The default value is 1%, what does this give us? if there is a sharp increase, then we take away all the movement
Use only long?
Allow long?- Only long trades will be displayed
Allow short? Only short trades will be displayed
Allo reverse? Upon receipt of a return signal, the opposite position will be closed.
//MARTINGALE GRID
If there is a check mark in the line "Use martingale and grid?"
then the grid will be active
If there is a check mark in the "Limit each next entry,%?" then, even if the entry from the bot logic is triggered, and the price does not fall by the specified percentage, then there will be no entry!
If there is a check mark in the "Grid,%" column, then purchases with martingale support will be added with a decrease by the specified percentage!
PS: "Grid" always starts anew, as the input from logic triggered!
//FILTER SETTINGS
1) Use filter oscillator? (The filter uses 7 averaged oscillators)
Period-the period for which you will be billing
Upper line-Short entry border.
(if 40, then there will be no entry until it reaches)
Lower line-Long entry border.
(20 until below 20 no entry)
2)Use filter range?
Filter type-moving average selection
Bars back-offset speed based on number of last bars
Period-period to calculate
3)Use filter supertrend?
Supertrend filter with multitimeframe
// How do filters work 2 and 3?
Filters can work either one by one or together.
A trade is entered when conditions from the logic and filters in the red zone are triggered, when there are no entries in the green zone.
//DATA RANGE:
-Testing results for any period of time
//PIRAMIDING
-Also in the settings there is a pyramid of order, keep this in mind. Make a deal for a small part of the deposit, and not for all the money at once!
PS: to use martingale, you need to write in the hook messages:
"amount": "{{strategy.order.contracts}}" (purchases will be in the amount of coins equivalent to USDT)
The default settings for TF are 1 minute, 10 inputs.
You can choose your settings for any TF, but look at different coins to make sure you have good statistics
BTCUSD
Fukuiz Octa-EMA + Ichimoku (Strategy)This strategy is based EMA of 8 different period and Ichimoku Cloud which works better in 1hr 4hr and daily time frame.
#A brief introduction to Ichimoku #
The Ichimoku Cloud is a collection of technical indicators that show support and resistance levels, as well as momentum and trend direction. It does this by taking multiple averages and plotting them on a chart. It also uses these figures to compute a “cloud” that attempts to forecast where the price may find support or resistance in the future.
#A brief introduction to EMA#
An exponential moving average ( EMA ) is a type of moving average (MA) that places a greater weight and significance on the most recent data points. The exponential moving average is also referred to as the exponentially weighted moving average . An exponentially weighted moving average reacts more significantly to recent price changes than a simple moving average ( SMA ), which applies an equal weight to all observations in the period.
#How to use#
The strategy will give entry points itself, you can monitor and take profit manually(recommended), or you can use the exit setup.
EMA (Color) = Bullish trend
EMA (Gray) = Bearish trend
#Condition#
Buy = All Ema (color) above the cloud.
SELL= All Ema turn to gray color.

Saturday Strategy BTC By KziI take the hypothèse that saturday is the most stable day of the week because, no SP500, no fed announcement and no weekly closure.
My Strategy is very simple:
Take the friday color (Red = Short // Green = Long)
Then open at the friday close price
Take a small pourcentage (1 or 2 %) then close.
What ever close on midnight.
Work Well on the 1h chart.
The Yellow is the saturday.
Maybe we can add the monthly close information to avoid opening trade on saturday if we are at this event.
Enjoy and give me your comment.
Kzi

Chanu Delta RSI StrategyThis strategy is built on the Chanu Delta RSI , which indicates the strength of the Bitcoin market. The problem with the previous Chanu Delta Strategy was that it was simply based on the price difference between the two Bitcoin markets, so there was no universality. However, this new Chanu Delta RSI strategy solves the problem by introducing an RSI that compares the price difference trend.
When the Chanu Delta RSI hits “Bull Level” and “Bear Level” and closes the candle, long and short signals are triggered respectively. The example shown on the screen is a default setting optimized for a 4-hour candlestick strategy based on the Bybit BTCUSDT futures market. You can use it by adjusting the setting value and modifying it to suit you.
This strategy is selectable from both reference and large amplitude BTCUSD markets in order to enable fine backtesting. I recommend using BYBIT:BTCUSDT for the reference market and COINBASE:BTCUSD for the large amplitude market.
(Note) Using the "Chanu Delta RSI" to know the current indicator value in real time, it is convenient to predict the signal of the strategy.
(Note) Because the Chanu Delta RSI represents the price difference based on the Bybit BTCUSDT futures market, backtesting is possible from March 2020.
_____________________________________________________________
이 전략은 비트코인 시장의 강점을 나타내는 Chanu Delta RSI를 기반으로 합니다. 기존 Chanu Delta 전략의 문제점은 단순히 두 비트코인 시장의 가격차를 기준으로 하여 보편성이 없었다는 점이다. 하지만 이번 새로운 Chanu Delta RSI 전략은 가격차이 추세를 비교하는 RSI를 도입해 문제를 해결했습니다.
Chanu Delta RSI가 "Bull Level"과 "Bear Level"에 도달하고 봉마감하면 롱, 숏 신호가 각각 트리거됩니다. 화면에 보이는 예시는 Bybit BTCUSDT 선물 시장을 기반으로 한 4시간 캔들스틱 전략에 최적화된 기본 설정입니다. 설정값을 조정하여 자신에게 맞게 수정하여 사용하시면 됩니다.
이 전략은 정밀한 백테스팅을 가능하게 하기 위해 참조 및 큰 진폭 BTCUSD 시장에서 모두 선택할 수 있습니다. 참조 시장에는 BYBIT:BTCUSDT를 사용하고 큰 진폭 시장에는 COINBASE:BTCUSD를 사용하는 것이 좋습니다.
(주) "Chanu Delta RSI"를 이용하여 현재 지표 값을 실시간으로 알 수 있어 전략의 시그널을 예측하는데 편리합니다.
(주) Chanu Delta RSI는 바이비트 BTCUSDT 선물시장을 기준으로 가격차이를 나타내므로 2020년 3월부터 백테스팅이 가능합니다.

BTC Cap Dominance RSI StrategyThis strategy is based on the BTC Cap Dominance RSI indicator, which is a combination of the RSI of Bitcoin Market Cap and the RSI of Bitcoin Dominance. The concept of this strategy is to get a good grasp of the bitcoin market flow by combining bitcoin dominance as well as bitcoin market cap.
BTC Cap Dominance (BCD) RSI is defined as:
BCD RSI = (BTC Cap RSI + BTC Dominance RSI) / 2
Case 1 (Bull market):
Both Cap RSI and Dominance RSI values are high
Case 2 (Neutral market):
Cap RSI is high but Dominance RSI is low
Cap RSI is low but Dominance RSI is high
Case 3 (Bear market):
Both Cap RSI and Dominance RSI values are low
When the BCD RSI value closes the candle above the Bull level, it triggers a long signal and when the value closes below the Bear level, it triggers a short signal.
(Note) Please note that TradingView's market cap symbols (CRYPTOCAP:TOTAL and CRYPTOCAP:TOTAL2) started in January 2020, so strategy backtesting is possible from this point on.
(Note) Since the real-time BCD RSI value does not come out with this strategy, it is recommended to use it together because the current value can be known and the long-short signal can be predicted in advance by using a separate BCD RSI Index together.
If "Use Combination of dominance RSI ?" is not checked in addition to the recommended default value of the strategy, the recommended values are Length (14), Bull level (74), Bear level (25).
_______________________________________________________________________
이 전략은 비트코인 시가총액의 RSI와 비트코인 도미넌스 RSI를 조합하여 만든 BTC Cap Dominance RSI 지표를 기반으로 만들어졌습니다. 이 전략의 컨셉은 비트코인 시가총액뿐만 아니라 비트코인 도미넌스를 조합함으로써 비트코인 시장 흐름을 잘 파악할 수 있도록 하는 것입니다.
BTC Cap Dominance (BCD) RSI는 다음과 같이 정의하였습니다.
BCD RSI = (BTC Cap RSI + BTC Dominance RSI) / 2
Case 1 (강세 장):
Cap RSI와 Dominance RSI 값 모두 높은 경우
Case 2 (횡보 장):
Cap RSI는 높지만 Dominance RSI는 낮은 경우
Cap RSI는 낮지만 Dominance RSI는 높은 경우
Case 3 (약세 장):
Cap RSI와 Dominance RSI 값 모두 낮은 경우
BCD RSI 값이 Bull level 위에서 캔들 마감할 경우 long 신호를 트리거하고 Bear level 아래에서 캔들 마감할 경우 short 신호를 트리거합니다.
(주의) 트레이딩뷰의 시가총액 심볼들 (CRYPTOCAP:TOTAL과 CRYPTOCAP:TOTAL2)이 2020년 1월부터 시작하였으므로 이 시점부터 전략 백테스팅이 가능한 점을 유의하십시오.
(주의) 이 전략은 실시간 BCD RSI 값이 나오지 않기 때문에 별도의 BCD RSI Index를 함께 사용하면 현재 값을 알 수 있어 롱숏 신호를 사전에 예측할 수 있으므로 함께 사용하기를 권장합니다.
전략의 추천 기본값 외에 "Use Combination of dominance RSI ?"를 체크하지 않는 경우 권장하는 값은 Length (14), Bull level (74), Bear level (25) 입니다.

Btcusdt - 4hr Trendreversal algoritmeIn this strategy we use a combination of differents indicators to catch the highs and lows and follow the right direction at all times.
The conditions of this 4hr algo are based on Ema's and WMA's that rise or fall:
Momentum;
Price Action
Volume
RSI
BB
I have backtested the algo for 2 years before i ran it live. I ran the algo live for 1 year now and ( October 2020) as for now the algo indicates a trend reversal 70-80% correctly.
The backtest result shown started from 01-10-2017and is simulated using 15% of the capital on BINANCE:BTCUSDT
I have varies Algo's on different Timeframes. If you're interested sent me a message.
Please be aware that past results are no guarantee for future performance!

BTC 30m ScriptWhat are your thoughts on this script? I connected it to Coinbase Pro via AWS lambda for auto-trading. I'm waiting for BTC to start bullish again before turning it on in production. Thoughts? Thank you! John
Linear Regression Channel Breakout StrategyThis strategy is based on LonesomeTheBlue's Linear Regression Channel Indicator. First of all, I would like to thank LonesomeTheBlue. Breaking the Linear Regression Channel to close the candle triggers a Long or Short signal. If the slope of the Linear Regression Channel is positive, it is Short when it breaks out the lower line, and when the slope is negative, it is Long when it breaks out the upper line. The default is optimized for 8-hour candles, and for other hour candles, find the optimal value yourself. Below is a description of LonesomeTheBlue's Linear Regression Channel.
이 전략은 LonesomeTheBlue의 Linear Regression Channel Indicator를 기반으로 만들어졌습니다. 우선 LonesomeTheBlue님께 감사의 말씀을 드립니다. Linear Regression Channel을 돌파하여 봉 마감하면 Long 또는 Short 신호를 트리거합니다. Linear Regression Channel의 기울기가 양인 경우 하단 라인을 돌파하면 Short이고 그 기울기가 음인 경우 상단 라인을 돌파하면 Long입니다. 기본값은 8시간봉에 최적화 되어 있으며, 다른 시간봉은 직접 최적값을 찾아보십시오. 아래는 LonesomeTheBlue의 Linear Regression Channel에 대한 설명을 퍼왔습니다.
________________________________________________
There are several nice Linear Regression Channel scripts in the Public Library. and I tried to make one with some extra features too. This one can check if the Price breaks the channel and it shows where is was broken. Also it checks the momentum of the channel and shows it's increasing/decreasing/equal in a label, shape of the label also changes. The line colors change according to direction.
using the options, you can;
- Set the Source (Close, HL2 etc)
- Set the Channel length
- Set Deviation
- Change Up/Down Line colors
- Show/hide broken channels
- Change line width
meaning of arrows:
⇑ : Uptrend and moment incresing
⇗ : Uptrend and moment decreasing
⇓ : Downtrend and moment incresing
⇘ : Downtrend and moment decreasing
⇒ : No trend

Simple EMA Crossing Strategy TradeMathSimple EMA Crossing strategy, based on crossover Fast exponential moving average = EMA21 and Slow exponential moving average = EMA55.
Default stop loss is 3%, but you can change it.
Default take profit is 9%, it based on stop loss.
Risk to Reward ratio is 1 to 3.
Strategy was tested on BTCUSDT 1H timeframe and works fine with these parameters.

[Joy] Jasmine Strategy for Bitcoin and CryptoIt is my strategy I use for spot and future trading, mostly for BTCUSD
Notable parameters used:
INDEX:BTCUSD
Data: 2017 - today
Long trade margin/leverage: 8x (50/8 = 6.25)
Short trade margin/leverage: 1x (50/50 = 1)
Commission: 0.075%
Initial Capital: $15, 000
Results:
Net profit: 832.74 %
Buy & Hold: 602.56 %. It beats the buy and hold.
Percent profitability: 88 % . It means 8 out of 10 trades resulted in profits.
Margin Calls: 0 (i.e. Never had a margin call according to backtest from 2017 till today)
Total closes trades: 25
Profit factor: 8.238
Avg Winning Trade: 43.08 %
Largest Winning Trade: 334.85 %
Avg # Bars in Winning Trades: 44 (i.e. 88 days)
Sharpe Ratio: 0.61. A Sharpe ratio under 1.0 is considered sub-optimal. Because of the big swings, I cannot make the Sharpe ratio any better at this time.
Sortino Ratio: 5.153. I think a Sortino ratio of 3.0 or higher is considered excellent. Do your research.
I am using 7.1% stop loss on long trades. However, you can turn off the stop loss and note the profitability remains the same.
Do remember there may be other costs, such as funding costs.
Description:
The strategy hunts for a few market features, namely breakouts, abnormal wicks relative to the body, abnormal volume relative to the candle characteristics, and possible confirmation of all these. It also hunts for more aspects. It gives a relative score of each of the characteristics. Finally, it tries to draw a guesstimate. In the end, it is only a guesstimate. Users see the final outcome (buy/sell etc). The whole logic happens at the background.
The strategy is not to be used for scalping, day trading or swing trading. In other words, it is not suitable for trading in a lower timeframe. It is to be used for Positional Trading For example, if one is trying this for BTCUSD, one may only try this for BTCUSD in a 2day timeframe and not in lower timeframes (such as 4 hours or 1 hour etc.) I am primarily interested in BTC for my research. However, it may be tested on other cryptos as well with varying degrees of results.
Please remember that past performance does not be indicative of future results. Different types of investments involve varying degrees of risk. There can be no assurance that the information referred to directly or indirectly in this strategy will be profitable, equal to any corresponding historical performance level(s), or suitable for you in any form or shape. Market condition changes very fast. Moreover, it would be best if you did not assume that any discussion or information contained here serves as the receipt of, or as a substitute for, personalized investment advice. I am not a financial advisor. I have no qualifications to be a financial advisor. It is only for educational and research purposes. Readers are encouraged to consult with a professional advisor of his/her choosing. Neither I nor my indicators or strategies take any responsibility for any misuse of the information for any actual trading. Even though this strategy did 88% profitability from 2017-2021, it may do poorly and may even be NOT profitable in the future.

supertrend strategyHI,
today I have finished to study another strategy, this time I have done a supertrend with a positive backtest untill 2015 in ETH / BTC pair.
It is very simple to understand and there are only 4 parameters:
The first 2 parameters are about supertrend u can change it as u want.
The last 2 parameters are about trailing stop and target profit, personally I use target 9.6% and trail 8%.
That's all, this is a very simple and profittable strategy.
My personal setting are 4,7,8,9.6
For info write me in private
Please press like, comment or follow :)

RSI+CMO Hybrid StrategyThis strategy is based on the RSI+CMO Hybrid Index I created. I modified both the original RSI and CMO so that the RSI+CMO Index value ranges from -100 to +100 and defined as follows. When the RSI+CMO Hybrid Index values close above the Bull Level and below the Bear Level, the strategy will trigger long and short signals respectively. This newly defined hybrid RSI+CMO indicator showed better win rates and better profits than the original CMO strategy. The default setting for this strategy is optimized for an 8-hour candle. For candles at different times, try to find the optimal value yourself.
* I was going to open the script, but recently there was a case of stealing my script and publishing it without permission, so I decided not to disclose it.
▶ Modified RSI = Original RSI - 50
Therefore,
Original RSI (0 ~ 100) → Modified RSI (-50 ~ +50)
▶ Modified CMO = Original CMO * 0.5
Therefore,
Original CMO (-100 ~ +100) → Modified CMO (-50 ~ +50)
▶ RSI+CMO Hybrid Index = Modified RSI + Modified CMO
Therefore,
RSI+CMO Hybrid Index (-100 ~ +100)
________________________________________________________
이 전략은 기존의 RSI와 CMO 지표를 수정하여 새롭게 정의한 하이브리드 RSI+CMO 지표를 기반으로 만들어졌습니다. 지표 값의 범위가 -100에서 100의 범위를 가질 수 있도록 기존의 RSI와 CMO를 수정하여 만들었습니다. RSI+CMO Hybrid Index 값이 Bull Level 이상과 Bear Level 아래에서 봉마감을 하면 이 전략은 각각 롱과 숏 신호를 트리거합니다. 이렇게 새롭게 정의된 RSI+CMO 지표는 기존 CMO 전략 대비 승률과 수익이 더 우수합니다. 이 전략의 세팅 기본값은 8시간봉에 최적화 되어있습니다. 다른 시간대 봉에서는 최적값을 직접 찾아보십시오. 그리고 이전략은 RSI+CMO Hybrid Index와 함께 사용하면 Long과 Short 신호를 예측할 수 있어 편리합니다.
* 최근에 제 스크립트를 도용/표절하여 무단으로 퍼블리쉬한 사례가 발생하여 더 이상 스크립트는 공개하지 않기로 하였습니다.

Chanu Delta Strategy V3This strategy is built on the Chanu Delta Indicator, which indicates the strength of the Bitcoin market. When the Chanu Delta Indicator hits “Delta Bull” and “Delta Bear” and closes the candle, long and short signals are triggered respectively. The example shown on the screen is a default setting optimized for a 4-hour candlestick strategy based on the Bybit BTCUSDT futures market. You can use it by adjusting the setting value and modifying it to suit you.
This new version is selectable from both reference and large amplitude BTCUSD markets in order to enable fine backtesting. I recommend using BYBIT:BTCUSDT for the reference market and INDEX:BTCUSD for the large amplitude market.
If you use this strategy in conjunction with the Chanu Delta Indicator, it is convenient to anticipate alert signals in advance. Because the Chanu Delta Indicator represents the price difference based on the Bybit BTCUSDT futures market, backtesting is possible from March 2020.
▶ Improvements and originality compared to the previous version
1. Selectable BTCUSD reference and large amplitude markets
2. Improvement of the SL/TP Function
- Improved SL/TP function based on the actual entry price of the position.
- Application of SL/TP function can be turned on/off.

Traffic Lights Strategy4HS Crypto Market Strategy
This strategy uses 4 ema to get Long or Short Signals
Length are: 4, 9, 18, 100
We take long positions when the order of the emas is the following:
green > yellow > red (As the color of Traffic Lights) and they are above white ema (Used as a filter for long positions)
We take short positions when the order of the emas is the following:
green < yellow < red (As the color of inverse Traffic Lights) and they are below white ema (Used as a filter for short positions)
Enable Long and/or Short Positions in settings
Enable Profit and Stop in strategy settings with different percentage to backtest the strategy. Also if it is better to use a Traditional Stop Loss or a Trailing Stop Loss based on ATR
Change ema filter resolution in settings for better strategy performance
This Strategy was tested on Crypto Market with good results in assets as BTC, ETH, BNB, ADA, LTC, XLM, BCH, among others
Feel free to optimize this strategy, optimizing its parameters. Each asset has its own "personality".

MyTradePartnerMyTradePartner strategy makes the cryptocurrency markets buy and sell automatically. 5 stoploss, fixed profit take and stoploss level can be customized from strategy settings. There are 4 separate strategies that you can set in the strategy. First of them, there are strategies that decide long and short positions in accordance with your settings at the pivot levels, second of the super trend, third of the potential return levels, third of the up and down breaks. Pyramiding can offer multiple entry points. Strategy back tests can be adjusted to the desired time period and can be used as spot or term if desired. Frostybot is set to work fully compatible with js when the necessary inputs are made from these strategy settings. When installing an alarm for FROSTYBOT JS, the alarm message field is {{strategy.order.alert_message}}.
FEATURES:
-Fully compatibly with Frostybot
-High Percent Profitable strategy up to %60
-İnclude five level Trailing Stoploss, fixed stoploss and takeprofit with position size management
-include four strategy mentably in one strategy use one, use two or both
-All settings are customizable. Create your unique strategy with settings.
Optimized Keltner Channels SL/TP Strategy for BTCThis strategy is optimized for Bitcoin with the Keltner Channel Strategy, which is TradingView's built-in strategy. In the original Keltner Channel Strategy, it was difficult to predict the timing of entry because the Buy and Sell signals floated in the middle of the candle in real time. This strategy is convenient because if the bitcoin price hits the top or bottom of the Keltner Channel and closes the closing price, you can enter Buy or Sell at the next candle start price. In addition, this strategy provides Stop Loss and Take Profit functions to maximize profit.
_________________________________
Recommended settings are below.
- length: 9
- multiplier: 1
- source: close
- (v) Use EMA
- Bands Style: Average True Range
- ATR Length: 19
- Stop Loss (%): 20
- Take Profit (%) : 20
_________________________________
- length: 9
- multiplier: 1
- source: close
- (v) Use EMA
- Bands Style: Average True Range
- ATR Length: 18
- Stop Loss (%): 20
- Take Profit (%) : 5
_________________________________
▶ Usefulness and Originality
- Stop Loss and Take Profit functions are available
- Convenient Buy and Sell entry compared to the original Keltner Channel Strategy
- Optimized for BTCUSD market (maximizing profits)
___________________________________________
이 전략은 TradingView의 Built-in 전략인 Keltner Channel Strategy를 비트코인에 맞게 최적화되었습니다. 기존의 Keltner Channel Strategy는 Buy, Sell 신호가 캔들 중간에 실시간으로 떠서 진입 시점을 예측하기 어려운 불편함이 있었지만 이 전략은 비트코인 가격이 Keltner Channel 상단 혹은 하단을 찍고 종가를 마감하면 그 다음 캔들 시작가에서 Buy 혹은 Sell 진입이 가능하여 편리합니다. 또한, 이 전략은 Keltner Channel을 만나서 캔들을 마감한 가격 (bprice, sprice)을 시각적으로 plot을 제공하여 타점 및 차트를 보기에 편리하며 손절가 및 목표가를 지정한 백테스팅이 가능합니다.

Chanu Delta StrategyThis strategy is built on the Chanu Delta Indicator, which indicates the strength of the Bitcoin market. When the Chanu Delta Indicator hits “Delta_bull” and “Delta_bear” and closes the candle, long and short signals are triggered respectively. The example shown on the screen is a default setting optimized for a 4-hour candlestick strategy based on the Bybit BTCUSDT futures market. For the 15-minute candle, "Delta_bull=32", "Delta_bear=-31", "Source=hlc3" are best. You can use it by adjusting the setting value and modifying it to suit you.
If you use this strategy in conjunction with the Chanu Delta Indicator, it is convenient to anticipate alert signals in advance. Since the Chanu Delta Indicator represents the price difference based on the Bybit BTCUSDT futures market, backtesting is possible from March 2020.

GMMAs v2.0 CRYPTO [badshah_e_alam]Hello Traders ,
The GMMAs v2.0 CRYPTO strategy stands for gap modified moving averages designed for cryptos. This is a non Repainting Indicator.
This strategy version is a advanced and modified to one of my previously published indicator named as "gap modified moving average".
I am using my Modified Moving Average indicator for a while. I always wanted to add some more information to moving
averages and made some modification to Moving averages.
The additional Information I have added to the Moving Average helps it to act more quickly based on the price of that
particular asset.
How is strategy gives signals?
when the GMMA'w cross over or cross under the GMMA'y than a trade is taken depending on the filter status.
Info about the settings :
The default setting is for 11m ETHUSD , it works with other cryptos and other timeframe as well . For other timeframes it need to be fine tuned and need little change.
The first category is for the selection of Moving average to be modified and the source to be used for that moving average .
I have added seven moving averages to choose between. SMA works good for me , you can choose and play with other MAs.
following are the option to choose MAs
1.EMA
2.SMA
3.HMA
4.RMA
5.WMA
6.VWMA
7.SWMA
Next option in setting is GMMA'y and GMMA'w :
these two settings define the length and lookback period of the MA you have choosed above.
The length is similar to the length of the moving average chosen to be modified.
The lookback option will look for that number of bars for the modification.
GMMA'w is more sensitive than the GMMA'y. So make sure that the setting input of the GMMA'y is significantly larger than the
GMMA'w.
FILTER:
I have added TradingView inbuilt SUPERTREND as a filter in the strategy, it works very good in filtering out false trades
you can enable/disable it in the settings.
EXIT strategy:
The exit Strategy is based on ATR, Take profit and SL are decided by the ATR in the SL/TP setting option. You can change the RR ratio in the setting.
The backtest settings are as follow:
Initial capital:10k
Initial Commission = 0.000
Initial Pyramiding = 0
Reference :
Thanks to pinecoders and Tradingview community.
my previous gap modified moving average version is :https://in.tradingview.com/script/e3WestBa-Gap-Modified-Moving-Average/
watermark added from:
color gradient framework picked from :https://in.tradingview.com/script/hqH4YIFa-Color-Gradient-Framework-PineCoders/
DISCLAIMER
Any and all liability for risks resulting from investment transactions or other asset dispositions carried out by the user based on information received or a market analysis is expressly excluded by me.
All the information made available here is generally provided to serve as an example only, without obligation and without specific recommendations for action. It does not constitute and cannot replace investment advice. We therefore recommend that you contact your personal financial advisor before carrying out specific transactions and investments.
Do your own research and Risk management before taking any trade.

mark strategy2 divergence bot v0.5 for xbtusdHi first of all thanks for read this.
This is my second strategy for make trading, I optimized it for xbtusd with 30 min charts.
You can personalize some setting for reach a better result then me, these are the setting:
this script is only for long trade, so bearish divergence don't work
1)ema1
U can change this value for use another ema and use a faster or slower trend
2)ema2
U can change this value for use another ema and use a faster or slower trend
3)pivot right
U can change this value for watch a number of bar on your right
4)pivot left
U can change this value for watch a number of bar on your left
5)high range
U can change this value for watch a max number of bar
6)low range
U can change this value for watch a min number of bar
7)bullish
U can change this value for enable signal with bullish divergence
8)hidden bullish
U can change this value for enable signal with hidden bullish divergence
9)bearish
U can change this value for enable signal with bearish divergence
10)hidden bearish
U can change this value for enable signal with hidden bearish divergence
11)profit 1 %
U can change this value for the first take profit target
12)profit 2 %
U can change this value for the second take profit target
13)qty target 1 %
U can change this value for close a % of your trade at target 1
14)loss %
U can change this value for close the trade at a % of loss
Have nice day and send me a message if u will earn with my strategy.
If u want my code send me a message
for info send me a message

BTC|scanner|LONG|SHORT|30min STRATEGY- This strategy based on BTC|Scanner| v0.6b INDICATOR.
- Stop loss and take profit settings are available.
- This strategy can be used on a 30m timeframe and does not require fine tuning.
Detailed description of the strategy:
-According to the terms of the strategy:
-The initial deposit is $ 1000.
-The entry into the trade is carried out with the leverage from x3 to x8.
-Each entry/exit is shown by up/down arrows on the chart, the number of arrows shows the size of the leverage in the trade.
-Enter the trade with 100% of the deposit.
-All of the above suggests that with the input signal and the indication of the three arrows, an entry in the amount of$3000 will be made. If the shooter is 5, then$5000.
-Exit from the long/short position under the strategy conditions is carried out by 33% of the initial position volume on all TP (you can specify an unrealistic value of TP3, then the exit of 33% will be due only to an increase in the risk of further holding the position, but this can both increase profit and reduce it).
-To avoid distortion of the strategy indicators due to compound interest, it is recommended to take a period of a month to view statistics.
-The "Enter Confirm" field displays the confirmation of the trade, if several signals appear sequentially, the trade will be executed, and if the signal appears once, the trade will be skipped.
-The "ratio" field indicates the coefficient of change in activity on the current bar from the previous bar.
-The "Corner" field changes the angle of the stop loss correction depending on the time in the direction of reducing the loss.
-The "Short trigger" field indicates from which phase of activity you can open a short trade, conditionally this is a sinusoid with a lower limit of 0 and an upper limit of 100, but the sinusoid itself does not necessarily reach 0 and 100, the activity can stop at 80 and go towards 0 (initially the value 65 is specified).
-The "TP and Stop loss" fields are the percentage of profit / loss multiplied by 10. (the value 35 corresponds to 3.5%, 20-2% , and so on).
-The "cross action" field includes closing the trade when the activity sinusoid reaches the value of 99, regardless of any other calculations.
-The stop loss is displayed on the chart with orange and white dots.
The indicator and strategy can be applied not only to BTC , but it often has poor statistics on illiquid instruments.
////////////////////////////////////////////////////////////////////////////////////////////////////////////////////////////////////////////////////////////////////////////////
- Эта стратегия основана на индикаторе BTC|Scanner| v0.6b.
- Доступны настройки стоп-лосса и тейк-профита.
- Эта стратегия может быть использована на 30-минутном таймфрейме и не требует тонкой настройки.
Подробное описание стратегии:
-Начальный депозит составляет 1000 долларов.
-Вход в сделку осуществляется с кредитным плечом от х3 до х8.
-Каждый вход/выход отображается стрелками вверх/вниз на графике, количество стрелок показывает размер кредитного плеча в сделке.
-Вход в сделку на 100% депозита.
-Все вышесказанное говорит о том, что с помощью входного сигнала и индикации трех стрелок будет совершен вход на сумму 3000 долларов. Если стрелок 5, то 5000 долларов.
-Выход из длинной/короткой позиции по условиям стратегии осуществляется на 33% от объема начальной позиции по всем ТП (можно указать нереальное значение ТП3, тогда выход на 33% будет обусловлен только увеличением риска дальнейшего удержания позиции, но это может как увеличить прибыль, так и уменьшить ее).
-Чтобы избежать искажения показателей стратегии из-за сложных процентов, рекомендуется использовать месячный период для просмотра статистики.
-В поле "Enter Confirm" отображается подтверждение сделки, если последовательно появится несколько сигналов, сделка будет выполнена, а если сигнал появится один раз, сделка будет пропущена.
-Поле "ratio" указывает коэффициент изменения активности на текущем баре по сравнению с предыдущим баром.
-Поле "Corner" изменяет угол коррекции стоп-лосса в зависимости от времени в направлении уменьшения убытка.
-Поле "Short trigger" указывает, с какой фазы активности вы можете открыть короткую сделку, условно это синусоида с нижней границей 0 и верхней границей 100, но сама синусоида не обязательно достигает 0 и 100, активность может остановиться на 80 и пойти в сторону 0 (изначально указано значение 65).
-Поля "TP и Stop loss" - это процент прибыли / убытка, умноженный на 10. (значение 35 соответствует 3,5%, 20-2% и так далее).
-Поле "cross action" включает закрытие сделки, когда синусоида активности достигает значения 99, независимо от любых других расчетов.
-Стоп-лосс отображается на графике оранжевыми и белыми точками.
Индикатор и стратегию можно применить не только к BTC , но зачастую он имеет плохую статистику на неликвидных инструментах.
////////////////////////////////////////////////////////////////////////////////////////////////////////////////////////////////////////////////////////////////////////////////

Optimized Keltner Channels Strategy for BTCThis strategy is optimized for Bitcoin with the Keltner Channel Strategy, which is TradingView's built-in strategy. In the original Keltner Channel Strategy, it was difficult to predict the timing of entry because the Buy and Sell signals floated in the middle of the candle in real time. This strategy is convenient because if the bitcoin price hits the top or bottom of the Keltner Channel and closes the closing price, you can enter Buy or Sell at the next candle start price. In addition, this strategy provides a visual plot of the price (bprice, sprice) at which the candle is closed by hitting Keltner Channel.
▶ Usefulness and Originality
- Convenient Buy and Sell entry compared to the original Keltner Channel Strategy
- Optimized for BTCUSD market (maximizing profits)
___________________________________________
이 전략은 TradingView의 Built-in 전략인 Keltner Channel Strategy를 비트코인에 맞게 최적화되었습니다. 기존의 Keltner Channel Strategy는 Buy, Sell 신호가 캔들 중간에 실시간으로 떠서 진입 시점을 예측하기 어려운 불편함이 있었지만 이 전략은 비트코인 가격이 Keltner Channel 상단 혹은 하단을 찍고 종가를 마감하면 그 다음 캔들 시작가에서 Buy 혹은 Sell 진입이 가능하여 편리합니다. 또한, 이 전략은 Keltner Channel을 만나서 캔들을 마감한 가격 (bprice, sprice)을 시각적으로 plot을 제공하여 타점 및 차트를 보기에 편리합니다.

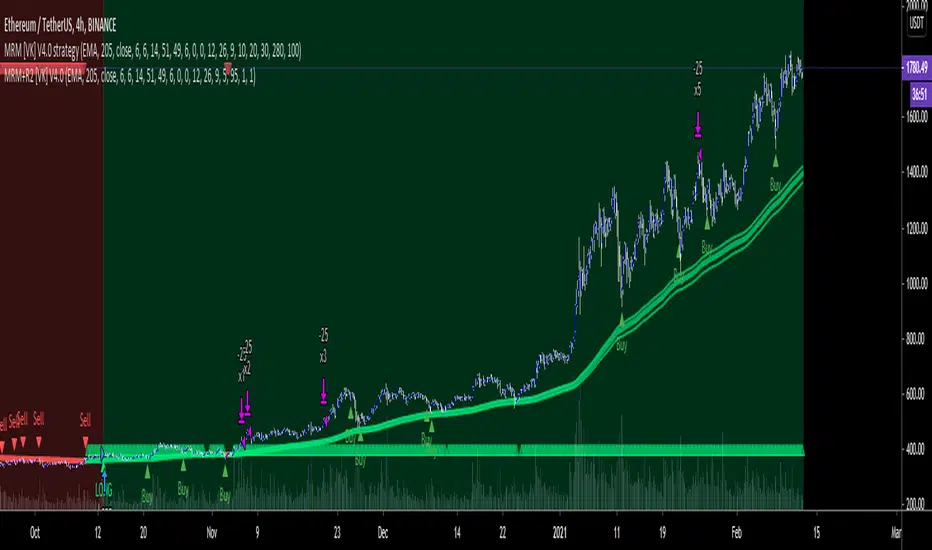
MRM [VK] V4.0 strategyMRM VK strategy
This strategy uses MA, RSI , MACD combined.
MACD and RSI can be used multi time frame to filter trend.
It is a very simple strategy which goes long/short when MACD , RSI and MA Trend Changes in higher Time Frame.
trendOne [Strategy]BITSTAMP:BTCUSD
trendOne
(strategy-tester)
It is not recommended to use this script for generating alerts. Use "trendOne Alerts" instead.
This script combines all our previous trend-based scripts (Bows, Autopilot, Trend Indicator, Price Deviation, etc) in only one script .
To calculate the trend we use:
Volume Weight
Average True Range
Bows calculations
Trends smoothed with alma() function.
For more accuracy on the signals and to filter unwanted signals we layered slower time-frames in the background and added breaking support & resistance rules.
Inputs
Sensitivity
Integer input. Sets the sensitivity for signals generated up and down. Higher values will generate less signals on chart, and vice-versa.
Enjoy!
Disclaimer:
Back-tests do not guarantee performance on the future. Even if a trading setup is profitable in historical data, it could be unprofitable in the future.
To get access to this and other scripts check links below.
