C2 Closure Alert From Key Level (FVG & Swings)This indicator is designed based on the C2 Closure Trader, specifically focusing on identifying high-probability C2 Candle Closures and Key Level Sweeps. It automates the detection of "Candle 2" setups where price sweeps a key level (Swing High/Low or FVG) and closes back inside, signaling a potential reversal or continuation.
Key Features :
Advanced C2 Detection:
Detects when the current candle (C2) sweeps the previous candle (C1).
Deep Context Check: It validates the setup by checking if C1 was interacting with a Key Level (Swing High/Low or FVG) OR if C1 just created a Fresh FVG.
Logic: Ensures no valid setup is missed, even if the sweep happens instantly after FVG creation.
Straight Sweep Lines (Visuals):
Draws a clean, straight horizontal line from the C1 High/Low to the C2 candle.
Helps you visualize exactly which level was swept.
Customization: You can change the line color and width from settings.
Smart FVG & Swing Levels:
Automatically plots Active Bullish/Bearish FVGs and Swing Highs/Lows.
Mitigation Logic: Levels remain active until a valid signal is generated or price invalidates them. Once used, they turn gray (mitigated) to keep the chart clean.
Mechanical Settings Menu:
Fully customizable inputs organized into clean groups (Algorithm, Signal, Visuals, Limits).
Label Size Control: Adjust the signal label size (Tiny to Huge) to fit your screen.
Transparent Labels: Clean "C2" text without background boxes for a professional look.
Robust Alert System:
Three specific alert options added for automation:
Bullish C2 Closure: Fires only on valid Long setups.
Bearish C2 Closure: Fires only on valid Short setups.
Any C2 Close: Fires on any valid setup.
Note: Alerts are strictly set to trigger Once Per Bar Close to avoid false signals during running candles.
How to Use:
Add to Chart: Apply the indicator to your timeframe (Recommended: 15m, 1H, 4H for narrative).
Identify Signals: Look for the "C2" text label.
Green C2: Bullish Setup (Sweep of Low + Close Up).
Red C2: Bearish Setup (Sweep of High + Close Down).
Validation: The indicator automatically checks if the sweep occurred at a valid Swing Point or FVG. If you see the signal, the context is valid.
Entry: Use the close of the C2 candle as your confirmation to frame a trade or look for lower timeframe entries.
Settings Guide:
Algorithm Sensitivity: Adjust Pivot Left/Right Bars to define how strict the Swing Highs/Lows should be.
Signal Appearance: Change the text (e.g., "Entry") or adjust the Label Size.
Active/History Limits: Control how many active or old (mitigated) lines/boxes stay on the chart to manage clutter.
Visuals: Customize colors for Bull/Bear FVGs, Highs/Lows, and Sweep Lines to match your chart theme.
Disclaimer: This tool is for educational and analytical purposes only. Always manage your risk properly.
Candleclose

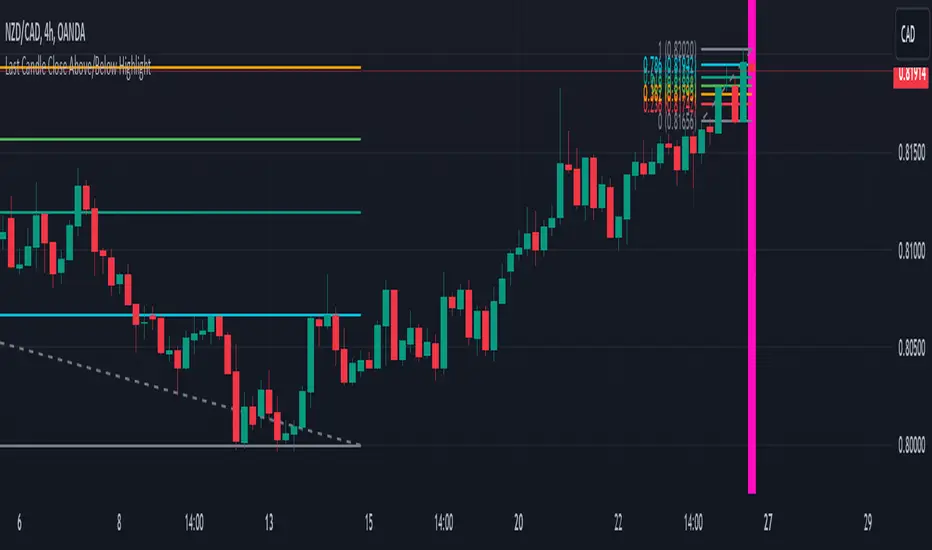
Last Candle Close Above/Below AlertHow it works:
The script calculates whether the close of each candle is above or below the close of the previous candle, same as the initial code.
isLastBar is checked and the last candle to be created is the only one that will receive the condition from this variable.
If a highlight is needed it will use this criteria and apply the correct color for the last candle only, and any other candle will not be colored.
If alerts are enabled they will only work for the last bar too.
How to Use:
Add this script to your TradingView chart.
Use the inputs to set the desired timeframe to analyze, whether you want an alert for candles closing above or closing below and the background colors.
The last candle will highlight yellow when the close is higher or lower than the previous candle.
Alerts will be triggered on the last candle if you enable the alert conditions.
Key Features:
Timeframe Selection: You can choose a different timeframe in the settings.
Candle Highlight: Candles that close above or below the previous candle are highlighted in yellow.
Alerts: Alerts are configurable to trigger for "Close Above" or "Close Below" conditions, based on your selection in the settings.
itradesize /\ Remaining Time - Candle close countdown A simple tool that displays the remaining time of M15, H1, H4, and D candles until they close.
Moreover, It works on all timeframes with all the exact data of the desired timeframe.
It can be such a useful tool when you using OHLC, AMD, and other theories. As you do not need to scrub back and forth through different timeframes to look for a bar close.
Notes:
• The Remaining Time Table only works in real time. It will show a “-“ sign, when you are in a replay mode.
This indicator has a Watermark section too where you can add your name/title/etc.. additionally, it shows the symbol, current timeframe, current date and you are able to customise them.

Candle Close AlertCandle Close Alert (CCA) :
The "Candle Close Alert" (CCA) is a custom technical analysis tool. It operates as an overlay on price charts and serves to detect and notify users about significant changes in consecutive candle closes. The script calculates the difference between the closing price of the current candle and the previous candle, referred to as the "close difference." It then compares this close difference against a user-specified threshold value.
When the close difference exceeds the threshold, the script triggers an alert, notifying users of a potential noteworthy event. This alert can serve as a prompt for traders and investors to investigate the current price action further or to consider possible trading decisions .
Additionally, the script enhances visualization by plotting the close differences on the price chart. Positive close differences exceeding the threshold are plotted in green, while negative close differences exceeding the threshold in magnitude are plotted in red. This color-coded visualization helps users quickly identify periods of significant price movement and potential market trends.
However, it's important to note that the CCA script is a standalone tool and should be used in conjunction with comprehensive market analysis. Trading decisions should not be solely based on the alerts and visualizations provided by this script. Instead, they should be considered within the broader context of other technical indicators, fundamental analysis, and risk management strategies. Enjoy it!

time between close 1.0 - find active charts
Title: Time Between Close (TBC) Indicator
Description:
The Time Between Close (TBC) Indicator is designed to help traders visualize the time between candle closes in seconds. The timeframe option default is set to 1 second. This is in order to check how often a candle is produced on the one second timeframe regardless of what timeframe your chart is on. These values of time between candles are then averaged using the moving average length.
So if you have a moving average length of 60, it will look at the past 60 candles and count the time between each candle, and give you an average in seconds. The shortest time between candles that it can go is 1 second.
The increment option should only be adjusted to a higher timeframes when you need to see further back because the existing plot is very short.
Note, this indicator is not suitable for BTC as BTC generally always has several ticks per second and the indicator will always show up as 1 second.
1. Timeframe options: Set the timeframe for measuring the time between candle closes (default: 1 second).
2. Moving average length: Choose between simple moving average (SMA) or exponential moving average (EMA) for calculating the average time between candle closes.
3. Time increment option: Adjust the time increment for the color gradient (default: 5 seconds). Increase this value for higher timeframes to see further back when the existing plot is too short.
4. Customizable label sizes, label distances, and horizontal line transparencies.
To get an idea of the gradient,
These are the colors from fastest moving to slowest:
Blue
Light Blue
Cyan
Light Green
Green
Yellow-Green
Yellow
Orange
Red-Orange
Red
