Stock Tech Bot One ViewTechnical indicators are not limited. Hence, here is another indicator with the combination of OBV, RSI, and MACD along with support, and resistance that follows the price while honoring the moving average of 200, 90 & 50.
The default lookback period of this indicator is 21 though it is changeable as per the user's desire.
The highest high and lowest low for the last 21 days lookback period proven to be the perfect Support & Resistance as the price of particular stock values are decided by market psychology. The support and resistance lines are very important to understand the market psychology which is very well proven with price action patterns and the lines are drawn based on,
Lower Extreme = 0.1 (Changeable)
Maximum Range = 21 days highest high - 21 days lowest low.
Support Line = 21 days lowest low + (Maximum Range * Lower Extreme)
Resistance Line = 21 days highest high - (Maximum Range * Lower Extreme)
RSI - Relative strength indicator is very famous to find the market momentum within the range of 0 - 100. Though the lookback period is changeable, the 14 days lookback period is the perfect match as the momentum of market movement for the last 3 weeks will always assist to identify the market regime. Here the momentum is just to highlight the indication (green up arrow under the candle for long and red down arrow above the candle for short) of market movement though it is not very important to consider if the price of the stock respect the support & resistance lines along with volume indicator (* = violet color).
OBV - Momentum:
The on-balance volume is always going indicator on any kind of tickers, which helps to identify the buying interest. Now, applying momentum on OBV with the positive movement for at least two consecutive days gives perfect confirmation for entry. A combination of the price along with this momentum(OBV) in the chart will help us to know the whipsaw in the price.
The Symbol "*" on top of each bar shows the market interest in that particular stock. If your ticker is fundamentally strong then you can see this "*" even when the market falls.
MACD:
One of the favorites and simple indicators widely used, where the thump of the rule is not to change the length even if it is allowed. It's OK to believe blindly in certain indicator and consider it while trading. That's why the indicator changes the bar color by following the MACD histogram.
Volume:
It may be the OBV works based on the open price and close price along with volume movement, it is wise to have the volume that is plotted along with price movement that should help you to decide whether the market is greedy or fearful.
The symbol "-" on top of each bar tells you a lot and don't ignore it.
Moving Average:
Moving average is a very good trend indicator as everyone considers seeing along with the price in the chart which is not omitted while we gauge the price movement alone with volume in this indicator. The 200, 90 & 50 MA's are everyone's favorite, and the same is plotted on the chart.
As explained above, the combination of all four indicators with price movement will give us very good confidence to take entry.
Candlestick Pattern:
You should admire the techniques of the candlestick pattern as you navigate the chart from right to left. Though there are a lot of patterns that exist, it is easy to enable and disable to view the signal as the label.
Further, last but not least, the exit always depends on individual conviction and how often the individual watch the price movement, if your conviction is strong then follow the down arrow red indication. If not, then exit with a trailing stop that indicates the bar with orange color.
Happy investing
Note: It is just a combination of multiple indicators and patterns to get one holistic view. So, the credit goes to all wise developers who publically published.
Candlestickpattern

Impactful pattern and candles pattern AlertThe Alertion indicator!
impactful pattern:
pattern that happen near the zone or in the zone at lower timeframe and give us entry and stop limit price.
It is helpful for price action traders and those who want to decrease their risk.
There are 3 IP patterns:
Quasimodo
Head and shoulder
whipsaw engulfing
These patterns may occur near the zone or may not occur but by them, you can decrease your trading risk for example you can
trade with half lot before IP pattern and enter with other half after pattern.
how to use?
for example:
you find zone at 1h timeframe for short position
when price enter to your zone
you run this indicator and choose your lower timeframe, for example 15m and click on short position.
Then make the alert by right-click on your chart and choose the add alert and at condition box choose the impactful pattern and then click on create
now wait for message :)
Candles pattern:
like reversal bar, key reversal bar, exhaustion bar, pin bar, two-bar reversal, tree-bar reversal, inside bar, outside bar
these occur when the trend turn, so it is usable when the price enter to your zone or near your zone.
This pattern can decrease your risk.
Inside bar and outside bar:
if this pattern engulf up, it is bullish pattern and if engulf down, it is bearish pattern.
what does this indicator do?
this indicator is for making alert
it helps you to decrease your risk and failure.
You optimize it to alert you when IP pattern happen or candle pattern happen or inside bar or outside bar engulfing or all of them.
For IP pattern, it will message you entry and stop limit price.
It works at 2 different timeframes, so you can make alert for example in 1h TF for candles pattern and 15m TF for IP pattern.
Indicator will alert you for candles pattern at your chart timeframe and for IP pattern at timeframe you've chosen when you run the indicator, and it is changeable
in setting.
setting options
TIMEFRAME
IP: select the timeframe for IP patterns it means when IP pattern happen at that timeframe the indicator will alert you
example = your TF is 1h, you found the supply zone and want to trade, note that IP pattern happen in lower TF, so you select 15m TF or TF lower than 1h.
Short position: select it if you want to make short position.
BUFFERING
indicator send you entry and stop limit price
you can change it by amount of percent
it is your strategy to change your entry and stop loss or not
example= in head and shoulder pattern at short position, the stop limit is high price of head in pattern
so the indicator will message you the exact price but if you want to put
your stop limit 5 percent upper than exact price you can enter 5 in front of stop loss
or you want to enter 5 percent lower than exact high price of shoulder, you can optimize it.
ALERTION
you choose what alert you want
IP alert or candle alert or inside and outside bar alert
type your text for alert
you can write additional text for your message
ADVANCE
IP alert frequency option:
1. Once per bar : indicator will alert you for IP pattern once at your chat timeframe bar, and you should wait til next bar for next alert.
2. Once per bar close : alert you when your chart timeframe bar closed and next alert will happen when next bar is closed.
3. All: alert you all the times IP pattern happen
pivot left and right bars: lower will find smaller pattern
at the END:
this indicator is not strategy
it is part of your strategy that help you to increase your winning rate.
It is helpful for scalping and candle patterns finding.
After you make an alert, you can delete the indicator or change your timeframe or make another alert, your previous alert won’t change.
Thank you all.

Simple Strat NumbersSimply Editable Strat Numbers.
Ones, Twos, Threes.
The only complicated part is the twos. You can edit the twos depending on if they are red or green candles and if they are up or down.

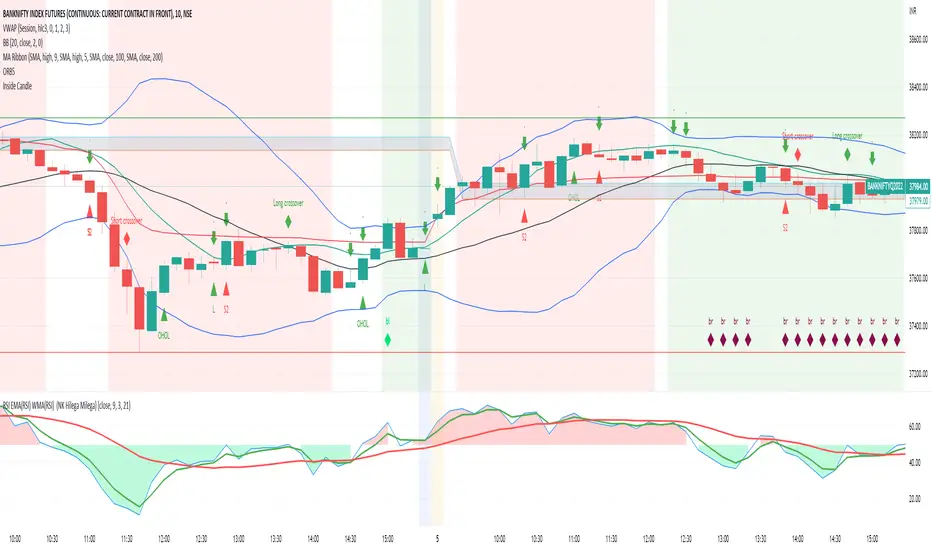
Inside Candle BB Blast ConvergenceThis script does the following
1. Identifies a BB Squeeze by turning the background green
2. Identifies if a price is above 9 sma h, sma 20 and vwap or otherwise through green and red diamonds at the bottom. Green is bullish. red is bearish
3. Identifies inside candles and basis previous patterns suggests long or short (L1, L2, S1, s2 etc)
4. Identifies long and short crossover when sma 9 h cross over or under sma 20
4. This works very well with BankNity in 10 minute chart. Not tried in any other
5. Use this with ORB, BB and VWAP indicator
6. Use the Hilega Milega System always to reconfirm trade. Search for it in youtube. It is by best teacher - N K Sir (N K Stock Talk)
Note: All trades to be done at your own responsibility. Please practice before you use and employ with your own patterns as suitable. What works for me may not work for you
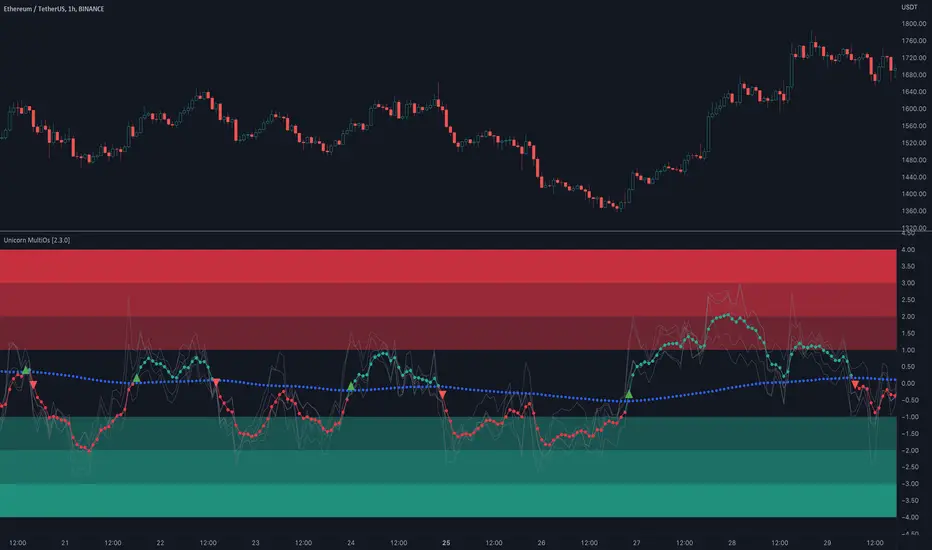
Unicorn MultiOsMultiOs is an oscillator that combines several widely used oscillators into one. In order to combine different oscillators, it is necessary to reduce them to a single scale. To do this we have developed a custom method based on z-scoring and adjusting by volatility .
The user can choose which of the oscillators from the list to combine into one. The combinations are countless. Some of the combinations may be a better fit for certain markets or trading styles. We call this new class of indicators obtained by combining several oscillators into one - "super oscillators". MultiOs provides a wide scopе for experimentation in creating different super oscillators. A good way to start is to combine all the oscillators from the list into one.
As our practice shows, combining several oscillators into one provides a number of advantages:
The compound super oscillator is smoother than any of its components, but its lag does not increase. This is due to the fact that the calculation does not require additional rolling window averaging. The averaging is performed over an ensemble of several non-smoothed oscillators. The signals are easier to read due to this alternative smoothing mechanism.
The signals are more meaningful and confirmed because they contain contributions from several oscillators and represent their consensus.
In the Candle Mode the MultiOs oscillator is plotted as a candlestick chart. You can apply all sorts of technical analysis to the oscillator candlestick chart, including candlestick patterns analysis. Reversal candlestick patterns in the overbought and oversold zones can give you leading price reversal signals.
We have also included an option to apply the regular smoothing to the MultiOs oscillator. The smoothing feature applies a simple moving average to the oscillator. The Smoothing parameter sets the period of the smoothing moving average.
This feature helps to reduce the number of false trend change signals. But don't forget that smoothing increases the indicator lag. So if you use smoothing, prefer smaller Smoothing parameter values (less than 10). And try to find the optimal tradeoff.
HOW TO USE
Choose which oscillators you would like to include into the mixture, and use the resulting super oscillator as your normal oscillator: forecast price reversals with overbought/oversold conditions and divergences, enter trends with zero line cross signals, detect narrow sideways markets when the oscillator fluctuates in the «gray zone» not going overbought or oversold.
When using this script, please, keep in mind that past results do not necessarily reflect future results and that many factors influence trading results.
SETTINGS
The indicator settings panel allows you to set the parameters that control the calculation and visualization of the indicator. You can also more deeply customize the display of the indicator on the Style tab of the indicator settings panel. This can be useful, for example, to change the colors or make some of the lines brighter.
GLOBAL MODE
Candle Mode - turns on/off the Candle Mode in which the MultiOs oscillator is plotted as a candlestick chart.
MAIN
Oscillator period - sets the oscillator period, which determines the size of the main rolling window, on which all calculations are made.
Smoothing - sets the oscillator smoothing intensity. The value 1 corresponds to the absence of smoothing.
Use Momentum, Use RSI , Use Stochastic , etc. - include/exclude the corresponding oscillator in/from the MultiOs calculation.
DISPLAY
Show MultiOS, Show Momentum, Show RSI , etc. - enable/disable the display of the corresponding oscillator.
Show Zero Line - enables/disables the display of the zero level.
Watchlist Screening Hammer & Engulfing Strategies [By MUQWISHI]A trading strategy screener is an idea of a visual alert for those who're trading particular strategies and facing a lack of capability of monitoring many symbols simultaneously, so this kind of tool could be more efficient to keep managing trading plans smoothly and quickly. I developed this screener as an idea more than providing legend strategies.
This screener indicator performs scanning 4 different strategies with customizable 10 symbols inputs, and 5 min is the preferable timeframe.
Strategies
1. Hammer at Low of the day.
2. Shooting Star at High of the day.
3. Bull Engulfing at Low of the day.
4. Bear Engulfing at High of the day.
Screener Overview
Disclaimer
I'm an amateur, and I'm not a qualified licensed investment advisor.
I don't recommend the use of showing signals as a sole means of trading decisions.

Time Machine█ OVERVIEW
This script is designed to display future and current time resistance levels based on multiple techniques such as candle behaviors and count and some significant financial times according to Gann and more.
Each chart consists of an X-Axis ( time ) and a Y-Axis ( price ). Price can travel up and down giving you both support and resistance levels, on the other hand, time only travels forward which is why they are called time resistance levels.
Time resistance happens at multiple significant places. Have you noticed that when a triangle breaks north or south that the tip of the triangle acts as time resistance level where something happens ? Many patterns and techniques are designed
to detect and these levels through patters, candle behavior and more. This script aims to assist in detecting these levels ahead of time or at candle opens . This is a very important point. A signal of time resistance can be displayed at candle open
or ahead of time. both of these cases mean that the time resistance is confirmed. These resistance levels are rated on a scale from 0 to 3 and this scale could change and more filtering could be applied in the future to make this script
even more powerful. I would say this is a functional beta version ( v0.5 ) that could be improved upon and that's what I intend to do. scroll down to see if there are any other upgrades to this script. Each time frame has its own time resistance levels. Future levels could appear at any point;
for example, if there are no future time resistance levels within the next 6 days -lets say,- this does not mean that one doesn't appear tomorrow. A regular check would give you an edge in this script. Of course this is something that can be improved in the near future. This script does not reprint ( confirmed data does not change ) but more future data can be added no previous data.
Enjoy!
█ Future Plans and upgrades to this script may include :
1. Adding more astro influencers into the script.
2. Fine tuning the script a bit more to filter unwanted noise.
3. Adding toggle switches for users to select from. ( toggle between multiple techniques )
and more! feel free to let me know what you'd like to see!
█ How to use :
1. Put the script on your chart
give the script a few seconds and you should be set.
This script is coded as an addon to the Gann ToolBox package/scripts.

Candle Stick UpdateHeikin ashi chart so powerful that you can understand trend direction easily. But sometimes, this type of chart doesn't update properly and make no sense on real time. So I made this script. You can now change candle stick style default to heikin ashi (default / modified version) on the real time default chart without switching heikin ashi chart. Enjoy traders!!! And don't forget to press the like button :)

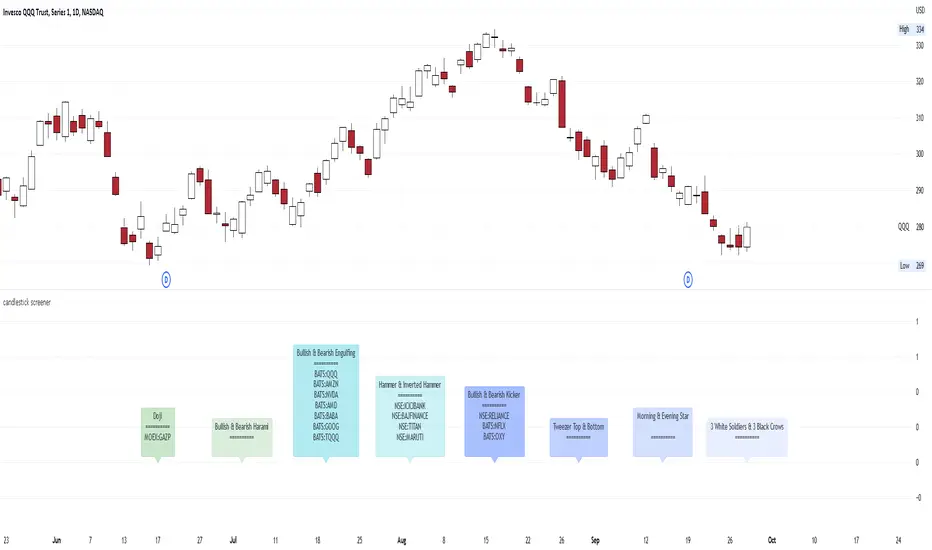
candlestick screenerhello traders..
I think it would be awesome if traders using a candlestick price action have a candlestick pattern screener.
so you just have to screen the securities, crypto, forex, commodities, spot the candlestick pattern easily and then you can set up trades..
This is a multi time frame candlestick screener, consist of:
1. Bullish & Bearish Kicker
2. Morning & Evening Star
3. Three White Soldiers & Three Black Crows
4. Tweezer Top & Bottom
5. Doji
6. Spinning Top & Bottom
7. Bullish & Bearish Harami
8. Bullish & Bearish Engulfing
9. Hanging Man & Shooting Star
10. Hammer & Inverted Hammer
the time frame of the screener, follows the Main Chart Time Frame;
- if your main chart in M5, then the result is in M5
- if your main chart in M15, then the result is in M15
- if your main chart in H1, then the result is in H1
- if your main chart in Daily, then the result is in Daily
- if your main chart in Weekly, then the result is in Weekly
- if your main chart in Monthly, then the result is in Monthly
Here are some the examples in multi time frame:
M5
M15
M30
H1
H4
Daily
Weekly
Monthly
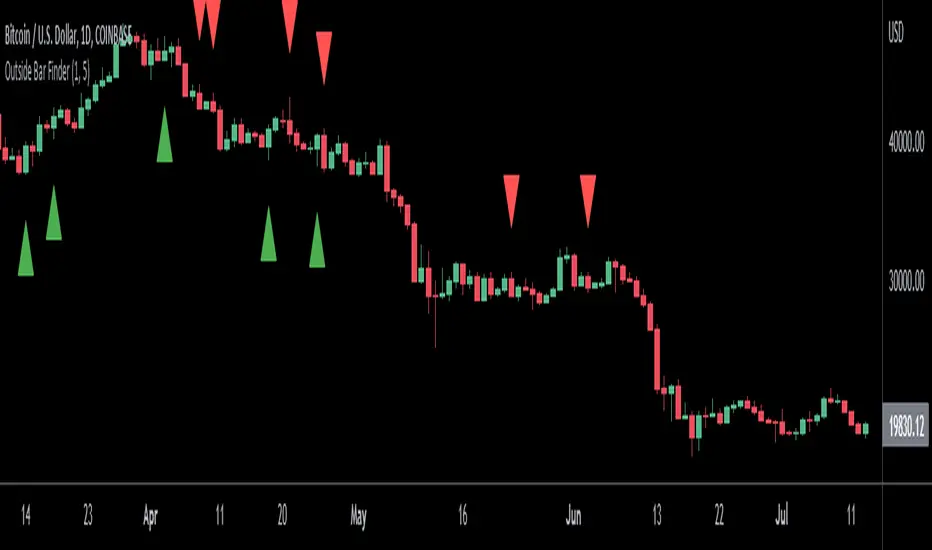
Outside Bar FinderOutside bars occur when the range of a candlestick falls entirely outside of the previous candlestick's range. This indicates indecision and volatility expansion which often leads to changes in trend direction.
This indicator includes options such as:
- The number of consecutive outside bars required to trigger the indicator
- An arrow indicating whether the outside bar is bullish or bearish
- Signal lines to indicate the high and low of the outside bar
Try out this indicator with different options on different timeframes to see if outside bars increase the probability of identifying changes in trend. Breaks or closes outside the signal lines can be used to trigger trade signals.
Lower time frame Intrabar CandlesI was looking for an indicator to show me what a lower time frame is doing at the start, middle, and end of the candle, but I couldn't find one, hench,
I made my own using Tradingview latest capabilities to fetch a lower time frame from a higher time frame chart.
For example, if your chart is 1 hour and this indicator is set to a lower time frame of 15 minutes, then the Start, Middle, or End (Select which in settings) of the 15min candle will be displayed overlaying the 1-hour candle.
This will always show you what the lower time frame candle is currently doing without the need to open an additional lower time frame chart. How cool is that?
Remember to select a lower time frame in the settings than the chart time frame for it to work as expected.
Enjoy :)
-=== Notes ===-
* The lower time frame candles BORDER is set to WHITE by default, however, you can adjust the color of the candle (wicks, body, and border) of the 'LTF Candle' indicator inside its Settings -> Style
* Suitable for candles and designed to work in historical and real time.
* Added optional label to show lower time frame values (can be disabled via indicator settings).
* You can adjust the visuals of the chart candles at Chart Settings -> Symbol -> Body, Borders, or Wicks to visually see better the lower time frame candles.
There is also a similar concept volume-based using histogram, stay tuned.
Like if you like and follow: www.tradingview.com

Fake breakHi Traders,
I've developed an indicator which can detect fake-breaks on the chart.
In the following you'll find the definition of the fake break candles and also you will find how to recognize it on the chart with practical examples.
What is the fake break pattern?
Sometimes support and resistance lines broke with a full body and strong candles that gives us the idea of sharp movements on the chart but suddenly the next candle returns all the path of the previous candle. in this case we can say fake break is happening on the chart.
This indicator detect fake break patterns based on two criteria:
1. It uses AverageTrueRange indicator to measure the strength of the pattern.
2. The returning candle should engulf minimum 75% of the break candle.
This indicator plot 2 terms in the name of "FB-D" and "FB-U" that are abbreviations of the "Fake Break Down" and "Fake Break Up".
You can also set alerts to get notified when fake breakout happens on the chart.
Notice: This pattern is only acceptable in valid support and resistance zones and you can not rely on it everywhere on the chart (specially in the middle of the waves).
Notice: The source code of this indicator is open and you are allowed to use it on your scripts by mentioning the name of author.
Disclaimer: This is not a financial advice or any signal to buy or sell, the goal of developing such an indicator is to use for educational purposes.

Aarika Heikin AshiHello Traders,
This indicator is probably based for the people who use HA candlestick chart and frequently have to switch between Japanese candlestick and HA candles. The worry is over with this simple indicator.
Now you can enjoy both candlesticks at the same time.
AHA allows you to have 2 EMAs (mostly used for crossovers). Default values set at 8/21 EMA which we may indicate a trend reversal.
We strongly recommend you back-test everything that you need before you start using AHA.
Thank you.

((Bullish)) Candle below EMA Hello People of the Trading World...
Todays script is a basic concept of using Moving Averages and Candle Closes - this works best on Higher Timeframes and only in Bullish Conditions
"When the market is trending to the upside - we tend to see price overextend from the moving average and price revert back to the mean (Mean Reversion)"
You may ask why would you want this candle - this presents good opportunities in a trending market (NOT AN ENTRY CANDLE). This can be useful to get into existing trends which you may have missed
This candle will display when the candle close is below one of the below EMAS
9EMA
50EMA
100EMA
You can choose which one to show ie if the 21ema wasnt important but the 100ema was... turn off the 21ema and 50ema and this will display candle below the 100ema
This candle can be alerted in the settings so if price does close you wont miss it.
EXMAPLES:
If you find this script useful please leave a comment and a thumbs up :)

Horns Pattern Identifier [LuxAlgo]The following script detects regular and inverted horn patterns. Detected patterns are displayed alongside their respective confirmation and take profit levels derived from the pattern measure rule. Breakout of the confirmation levels are highlighted with labels.
This script is a continuation of the educational idea regarding horns patterns.
Settings
Threshold: Controls the maximum allowed slope of the line connecting two horns, with higher values allowing a higher slope.
Usage
Horn patterns are chart patterns introduced by Bulkowski in his book "Encyclopedia of Chart Patterns". We covered this pattern in the following post: Horn Tops & Bottoms Patterns - How To Find and Trade Them
The script allows the user to quickly determine the presence of a regular or inverted horn pattern, alongside automatically displaying the confirmation level and take profits associated with a detected pattern. These are calculated based on the rules described by Bulkowski.
Horn patterns are highlighted by a line connecting the horns, the dotted lines represent the confirmation level, once the price crosses this level a label will appear, either bullish or bearish depending on the detected pattern. The dashed line represents the take profit level.

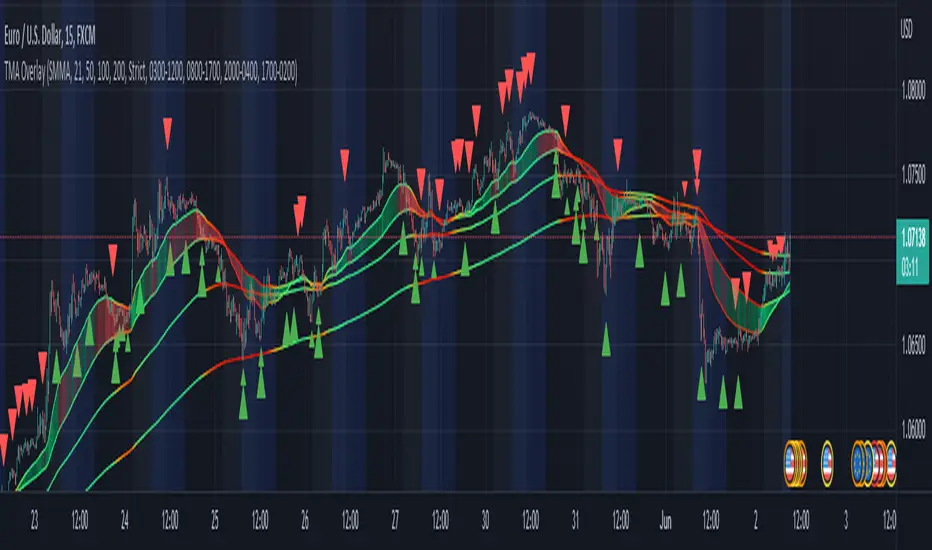
TMA Legacy - "The Arty"This is a script based on the original "The Arty" indicator by PhoenixBinary.
The Phoenix Binary community and the TMA community built this version to be public code for the community for further use and revision after the reported passing of Phoenix Binary (The community extends our condolences to Phoenix's family).
The intended uses are the same as the original but some calculations are different and may not act or signal the same as the original.
Description of the indicator from original posting.
This indicator was inspired by Arty and Christy .
Intrabar Polarity DivergencesTradingview Pinescript just introduced a new exciting ability to get intrabars candle information from a higher time frame chart!
This indicator is based on Tradingview example but with enhanced capabilities to show the percentage of intrabars opposite bars with the ability to display the mid-day candle close price drawn by a blue line.
This indicator can show you that in some cases a GREEN candle on the daily chart, for example, can have more red candles in a lower time frame. which may or may not indicate on a change of direction :)
This is an ongoing experiment and I plan to release more indicators based on these new pinescript capabilities.
Like if you like and Follow to stay updated!

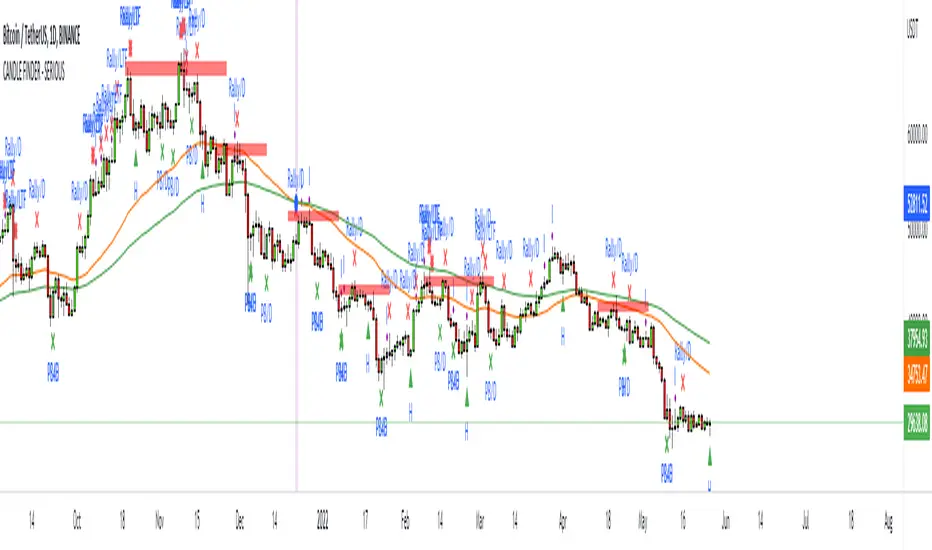
Intraday Candle Finder (Works on all Markets!!!) Todays scripts is for the INTRADAY Traders who would use a timeframe setup like (3m,5m,10,15m)
This script is a candle filter for Pulllbacks, Rally Candle, Hammers.
Ive added a new condition = RSI Overbought for the Rally Candle and Oversold for the Pullback to eliminate weak candles.
Also there is a ema filter if you want to only use the pullbacks above '50ema' etc...
Rules
1) Price action must be in place before we look for the signals
2) Trade in high probably areas such as Demand and Supply zones /// Support and Resistance zones
3) Dont trade Pullbacks when sentiment is Bearish
4) Dont trade Rallys when sentiment is Bullish
Pullback candle on INTRADAY TIMEFRAME
This was taken from ADA/USDT 31/05/2022 (Recent)
10M chart
Forex Example
Rally Candle on INTRADAY TIMEFRAME
This was taken from AXS/USDT 31/05/2022 (Recent)
Forex Example
How to trade this candles.
Stop loss = ATR *1 minimum
Take Profit = RR of either 4/5 when the market is trending // When the market is ranging - look to key levels for take profit
Im open to ideas to improve this script for the INTRADAY Traders as I'm more of a Swing Trader
If you enjoy this script please leave a like and comment as your support is much appreciated.

Volume Impulse & Candlestick Patterns - FontiramisuIndicator showing volume impulse & engulfing candlestick pattern.
You can set up multiple parameter for both events.
Volume Impulse :
Volume Period : Lenght of the average volume calculated.
Volume Multiplier : Factor to compare actual volume with average volume.
Engulfing Pattern :
VS avg body : Let you chose to compare body candle to average body of the last few candles (define with parameter : lenghtSizeAvgBody ), otherwise it will be compared to the last body candle.
Engulfing Multiplier : Factor to compare and validate the pattern.

CANDLE FILTER Todays scripts is based on my Pullback And Rally Candles with other meaningful candles such as Hammers and Dojis.
You can choose which Candles to show on the cart and if you want to candles to appear above or below a moving average.
If you follow my work, you may recognise some of these candles which I'm about to show you however these candles are 1) more refined and 2) has moving average filters.
Ive included a D,6H,1H Candle in this script as on different timeframes - each swing low on average has a different amount of bars within the swing low / swing high so the DPB and RD will only work on the Daily
//Pullback candle
This candle is very powerful when used with simple Price Action such as Market Structure//Demand zones and support zones. (((((WORKS BEST IN UPTRENDS AND BOTTOM OF RANGES)))))
Ive included a D,6H,1H Pullback Candle in this script as on different timeframes - each swing low on average has a different amount of bars within the swing low so the DPB will only work on the Daily
//DAILY PULLBACK (Swing Traders)
snapshot
//4H PULLBACK (Swing Traders)
snapshot
- this signal will produce more signals due to the swing low filter on the 4H
//1H PULLBACK
snapshot
- this signal has been refined due to too many candle displaying in weak areas
!!!IF YOU DONT WANT TO USE PULLBACKS DURING DOWNTRENDS THEN USE THE EMA FILTER TO TURN OFF THE PULLBACKS WHEN PRICE IS BELOW THE MOVING AVERAGE!!!
//Rally candle (My personal Favourite) (((((WORKS BEST IN DOWNTRENDS AND TOP OF RANGES)))))
This candle is very powerful when used with simple Price Action such as Market Structure//Supply zones and Resistance zones.
//DAILY RALLY(Swing Traders)
snapshot
//4H RALLY(Swing Traders)
snapshot
- this signal will produce more signals due to the swing high filter on the 4H
!!!IF YOU DONT WANT TO USE RALLIES DURING UPTRENDSTHEN USE THE EMA FILTER TO TURN OFF THE RALLIES WHEN PRICE IS ABOVE THE MOVING AVERAGE!!!
//POWERFUL DOJIS (INDECISION)
snapshot
We look for indecision in key areas to see if momentum is shifting. When combined with Pullbacks or Rallys - this will enhance the odds of a probably area.
//HAMMERS
snapshot
//MOVING AVERAGES
snapshot
Short EMA = 50
Long EMA = 200
This filter can be used when the market is trending - look out for rejections off the moving averages
Also you can chance the Short And Long EMA to choose which MA cross you want to use
snapshot
ALSO ALL THE CANDLES HAVE A ALERT CONDITIONS WHICH YOU CAN ACCESS - THIS WILL ALERT ANY CANDLE YOU CHOOSE
Please leave a like/comment on this post as this is much appreciated....

ULTIMATE CANDLESTICK FINDER (Pullback/Rallys/Hammers/Dojis) + MATodays scripts is based on my Pullback And Rally Candles with other meaningful candles such as Hammers and Dojis.
You can choose which Candles to show on the cart and if you want to candles to appear above or below a moving average.
If you follow my work, you may recognise some of these candles which I'm about to show you however these candles are 1) more refined and 2) has moving average filters.
Ive included a D,6H,1H Candle in this script as on different timeframes - each swing low on average has a different amount of bars within the swing low / swing high so the DPB and RD will only work on the Daily
//Pullback candle
This candle is very powerful when used with simple Price Action such as Market Structure//Demand zones and support zones. (((((WORKS BEST IN UPTRENDS AND BOTTOM OF RANGES)))))
Ive included a D,6H,1H Pullback Candle in this script as on different timeframes - each swing low on average has a different amount of bars within the swing low so the DPB will only work on the Daily
//DAILY PULLBACK (Swing Traders)
//4H PULLBACK (Swing Traders)
- this signal will produce more signals due to the swing low filter on the 4H
//1H PULLBACK
- this signal has been refined due to too many candle displaying in weak areas
!!!IF YOU DONT WANT TO USE PULLBACKS DURING DOWNTRENDS THEN USE THE EMA FILTER TO TURN OFF THE PULLBACKS WHEN PRICE IS BELOW THE MOVING AVERAGE!!!
//Rally candle (My personal Favourite) (((((WORKS BEST IN DOWNTRENDS AND TOP OF RANGES)))))
This candle is very powerful when used with simple Price Action such as Market Structure//Supply zones and Resistance zones.
//DAILY RALLY(Swing Traders)
//4H RALLY(Swing Traders)
- this signal will produce more signals due to the swing high filter on the 4H
!!!IF YOU DONT WANT TO USE RALLIES DURING UPTRENDSTHEN USE THE EMA FILTER TO TURN OFF THE RALLIES WHEN PRICE IS ABOVE THE MOVING AVERAGE!!!
//POWERFUL DOJIS (INDECISION)
We look for indecision in key areas to see if momentum is shifting. When combined with Pullbacks or Rallys - this will enhance the odds of a probably area.
//HAMMERS
//MOVING AVERAGES
Short EMA = 50
Long EMA = 200
This filter can be used when the market is trending - look out for rejections off the moving averages
Also you can chance the Short And Long EMA to choose which MA cross you want to use
ALSO ALL THE CANDLES HAVE A ALERT CONDITIONS WHICH YOU CAN ACCESS - THIS WILL ALERT ANY CANDLE YOU CHOOSE
Please leave a like/comment on this post as this is much appreciated....
Inside Bar FinderInside bars occur when the range of a candlestick falls entirely within the previous candlestick's range. This indicates volatility contraction which often leads to volatility expansion, i.e. large price movements.
This indicator includes options such as:
- The number of consecutive inside bars required to trigger the indicator
- Signal lines to indicate the high and low of the outermost or innermost bars
Try out this indicator with different options on different timeframes to see if inside bars increase the probability of identifying the direction of price movements. Breaks or closes outside the inside or outside signal lines can be used to trigger trade signals.

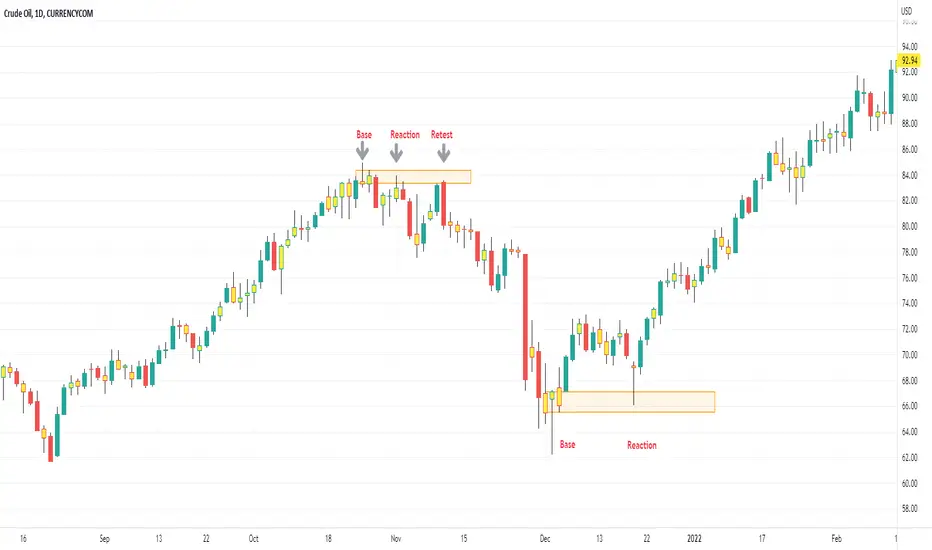
Base Candle NewBase / Imbalance Candle
It automatically highlights the candle color to yellow (default) where there is imbalance between buyers and sellers or in other words, a base or fight between buyers and sellers. When you identify this base candle, you can mark the demand and supply zones easily.