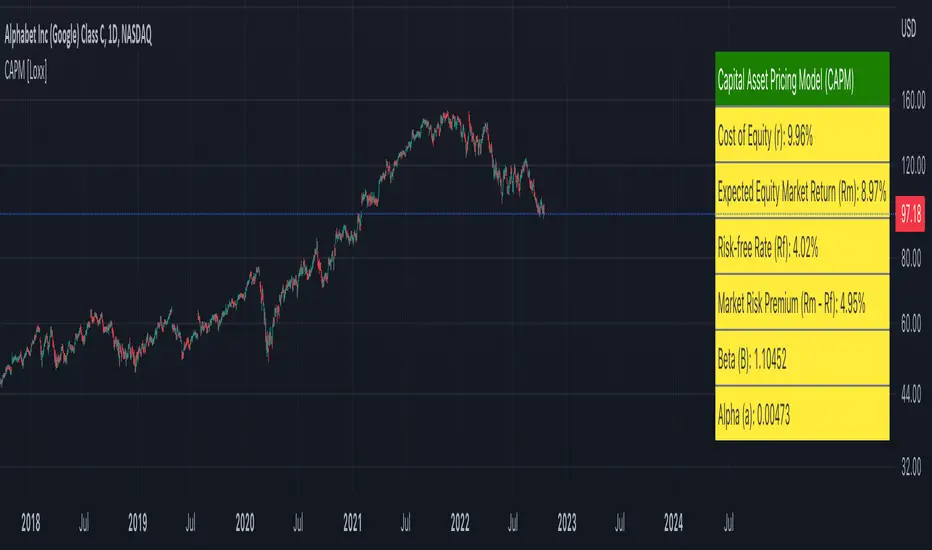
CAPM Alpha & BetaThe CAPM Alpha & Beta indicator is a crucial tool in finance and investment analysis derived from the Capital Asset Pricing Model (CAPM) . It provides insights into an asset's risk-adjusted performance (Alpha) and its relationship to broader market movements (Beta). Here’s a breakdown:
1. How Does It Work?
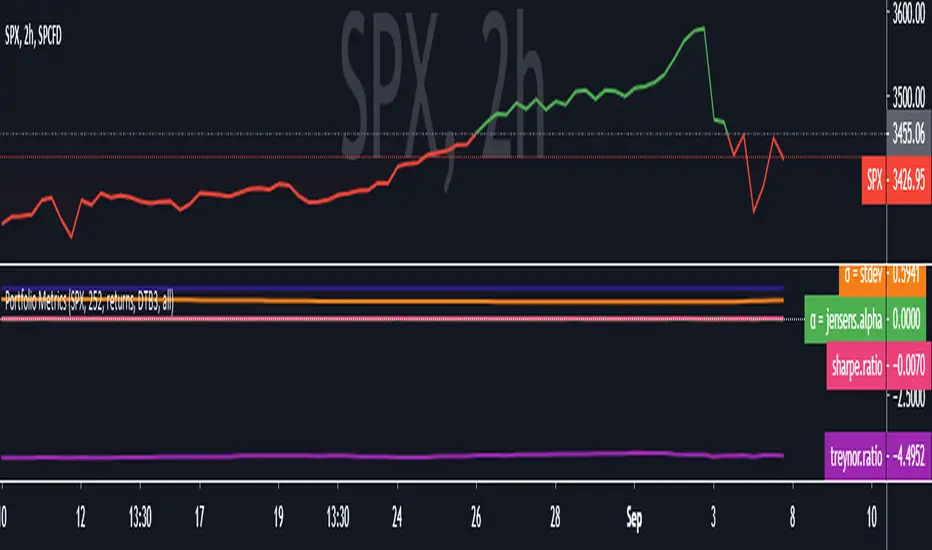
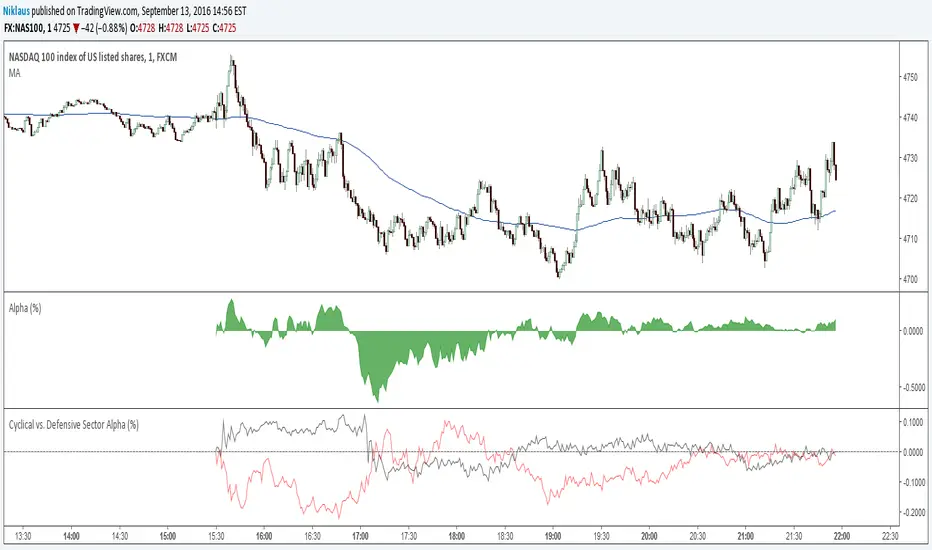
Alpha:
Definition: Alpha measures the portion of an investment's return that is not explained by market movements, i.e., the excess return over and above what the market is expected to deliver.
Purpose: It represents the value a fund manager or strategy adds (or subtracts) from an investment’s performance, adjusting for market risk.
Calculation:
Alpha is derived from comparing actual returns to expected returns predicted by CAPM:
Alpha = Actual Return − (Risk-Free Rate + β × (Market Return − Risk-Free Rate))
Alpha = Actual Return − (Risk-Free Rate + β × (Market Return − Risk-Free Rate))
Interpretation:
Positive Alpha: The investment outperformed its CAPM prediction (good performance for additional value/risk).
Negative Alpha: The investment underperformed its CAPM prediction.
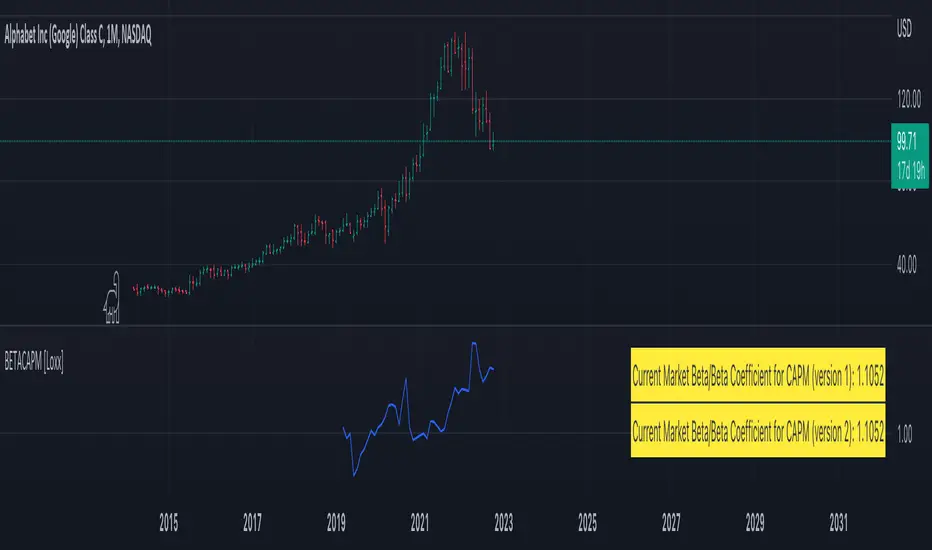
Beta:
Definition: Beta measures the sensitivity of an asset's returns relative to the overall market's returns. It quantifies systematic risk.
Purpose: Indicates how volatile or correlated an investment is relative to the market benchmark (e.g., S&P 500).
Calculation:
Beta is computed as the ratio of the covariance of the asset and market returns to the variance of the market returns:
β = Covariance (Asset Return, Market Return) / Variance (Market Return)
β = Variance (Market Return) Covariance (Asset Return, Market Return)
Interpretation:
Beta = 1: The asset’s price moves in line with the market.
Beta > 1: The asset is more volatile than the market (higher risk/higher potential reward).
Beta < 1: The asset is less volatile than the market (lower risk/lower reward).
Beta < 0: The asset moves inversely to the market.
2. How to Use It?
Using Alpha:
Portfolio Evaluation: Investors use Alpha to gauge whether a portfolio manager or a strategy has successfully outperformed the market on a risk-adjusted basis.
If Alpha is consistently positive, the portfolio may deliver higher-than-expected returns for the given level of risk.
Stock/Asset Selection: Compare Alpha across multiple securities. Positive Alpha signals that the asset may be a good addition to your portfolio for excess returns.
Adjusting Investment Strategy: If Alpha is negative, reassess the asset's role in the portfolio and refine strategies.
Using Beta:
Risk Management:
A high Beta (e.g., 1.5) indicates higher sensitivity to market movements. Use such assets if you want to take on more risk during bullish market phases or expect higher returns.
A low Beta (e.g., 0.7) indicates stability and is useful in diversifying risk in volatile or bearish markets.
Portfolio Diversification: Combine assets with varying Betas to achieve the desired level of market responsiveness and smooth out portfolio volatility.
Monitoring Systematic Risk: Beta helps identify whether an investment aligns with your risk tolerance. For example, high-Beta stocks may not be suitable for conservative investors.
Practical Application:
Use both Alpha and Beta together:
Assess performance with Alpha (excess returns).
Assess risk exposure with Beta (market sensitivity).
Example: A stock with a Beta of 1.2 and a highly positive Alpha might suggest a solid performer that is slightly more volatile than the market, making it a suitable pick for risk-tolerant, return-maximizing investors.
In conclusion, the CAPM Alpha & Beta indicator gives a comprehensive view of an asset's performance and risk. Alpha enables performance evaluation on a risk-adjusted basis, while Beta reveals the level of market risk. Together, they help investors make informed decisions, build optimal portfolios, and align investments with their risk-return preferences.
Pine Script® indicator