Moving average cloud strategyHi folks!
Here a script uses the moving average cloud. A sma (50, aqua) and a sma (200, olive) are plotted on the cart. When both sma go up the cloud is green. When both sma go down the cloud is red. When sma (200, olive) goes down and sma (50, aqua) goes up the cloud is orange. When sma (200, olive) goes up and sma (50, aqua) goes down the cloud is lime.
There three entry points in this strategy.
Long
Aggressive: When the cloud turns orange and price closes above the sma (200).
Neutral: When the both sma make the golden cross.
Cautious: When the cloud is green and price closes sma (200) after searching for support. So not when there's a great distance between them.
In case you missed the entry point you can jump in when price CLOSES above sma (50). So after it searched for support on that line. The cloud has to be green at that moment.
Short
Aggressive: When the cloud turns lime and price CLOSES below the sma (200).
Neutral: When the both sma make the death cross.
Cautious: When the cloud is green and price is above the sma (200).
In case you missed the entry point you can jump in when price CLOSES above sma (50). So after it searched for support on that line.
There are also two exit points in this strategy.
Cautious: When price closes on the other side of the sma (50).
Neutral: When the cloud changes color.
Aggressive: When price closes on the other side of the sma (200). There's always the opportunity that the price searches for support at the sma (200) line and goes from that moment in the direction you want.
Don't wait for the cross of the both sma. Very usually you give a huge part of your profit away at that point.
Remember: Above the cloud is bullish area, never go short there. Below the cloud is bearish area, never go long there.
Remember 2: When the clouds changes rapidly from color we're not in a trend. The sma (200) will be almost flat at those situations. It's a sign not to go into a trade since the market doesn't know in which direction it will go.
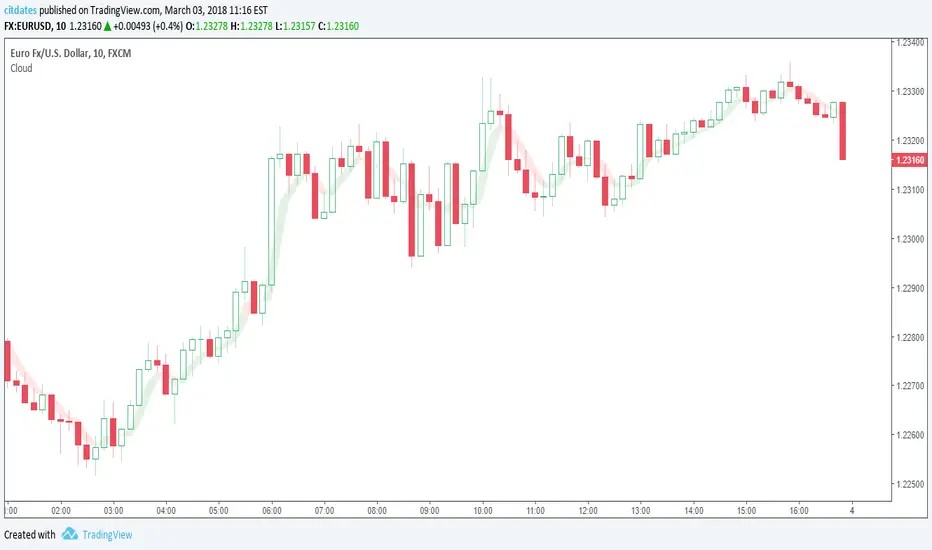
Cloud

Moving cloud avarage Two simple moving avarages are plotted. With a green color when bullish and red when bearish. Periods are 100 and 200, but very easy to change in the pine editor.

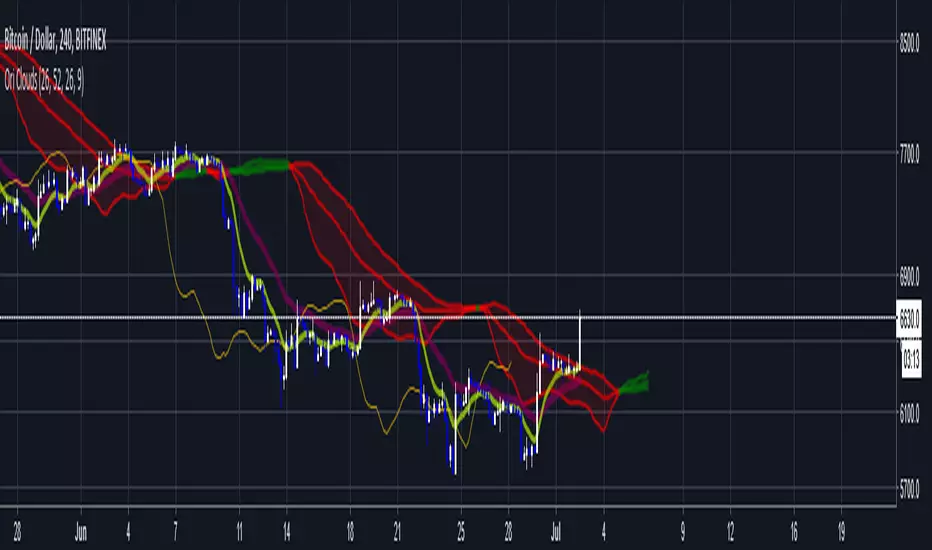
Ori Clouds (Better Ichimoku)Logic is similar to ichimoku . Last cloud color is also important for trend confirmation. Cloud lines important. There is a 3 line cloud which is different from ichimoku .
Logic is same but all calculations are different from ichimoku so be careful this is not the same indicator.
Here is classic Ichimoku for comparison
Linear Regression Cloud [R1984]TradingView Pine script to compare fast vs slow linear regression lines measured in days.
This indicator compares fast and slow linear regression lines, and that's it!
The fast line crossing above the slow line is generally bullish. The fast line crossing below the slow line is generally bearish. The lines and the space between them tend to act as resistance and support relative to the price movement against them.
30 days as the fast line and 60 days as the slow line appear to work well for BTC/USD. Check out multiples of that too: 15/30, 45/90, and 60/120.
Source code available here: github.com

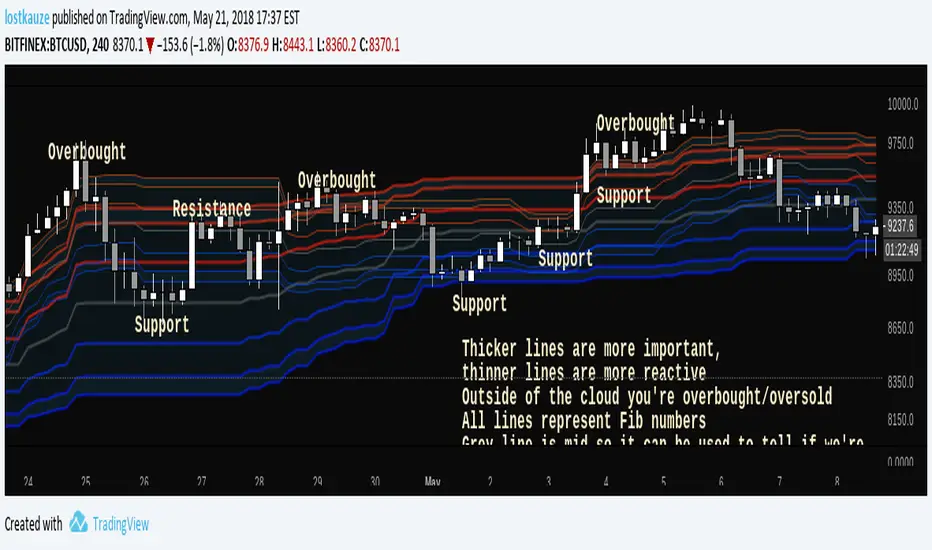
Fibonacci CloudInspired by Ichimoku Fibonacci Hybrid , this indicator is for those who don't mind a lot of lines. All lines represent Fib ratios: thicker lines are fibs for a longer period, while thinner lines are fibs for a shorter period.
- Dynamic S/R
- Overbought/Oversold zones
- Trend indicator
- Customisable periods
- Fast/Slow crossovers
See what works for you!
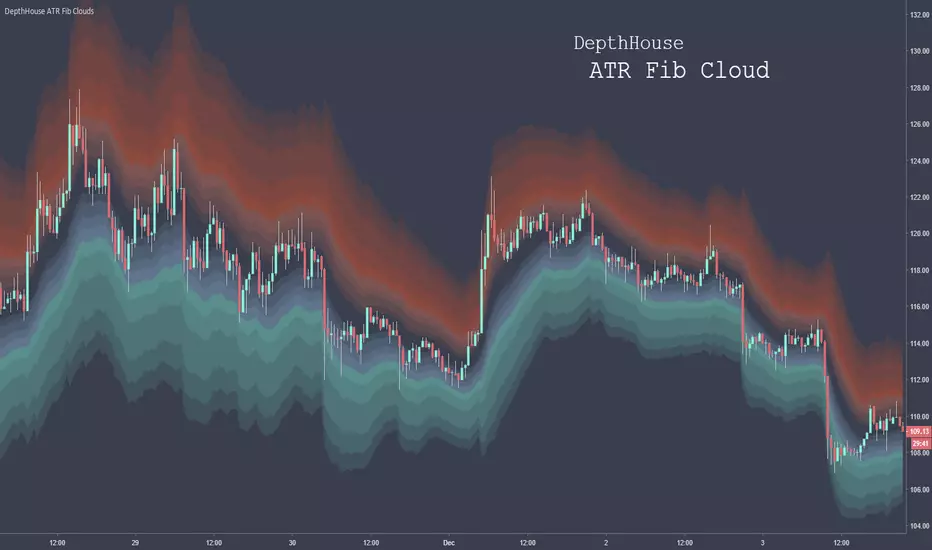
DepthHouse - ATR Fib CloudsDepth House ATR Fib Clouds is used to help traders spot dynamic support, resistance, retracement zones, and over-extensions.
Here is a video which I give a brief overview and show it in action:
youtu.be
Based on the zoning colors above:
Red and Blue zones represent common retracement zones.
Green and Orange zones represent possible over-extension zones, and trend changes.
This tool can also help differentiate between bull and bear markets on larger time frames. Trending markets tend to stick within the bottom or top of the loud zones.
Please Note: There are NOT trading signals. Each colored candle represents nothing other than a possibility of which way the trend may go. Be sure to use your own adequate analysis. Use at your own financial risk.
How to get:
As you can see this is an invite only script. In the coming months this indicator, along with many others will become pay to use only. (website on my profile page)
However all my indicators will be FREE until May 1, 2018. So please try them out!
To take advantage of this FREE trial :
1. Subscribe to my YouTube channel. I have many more videos to come! Maybe even leave a comment of what you would like to see next!
2. Comment on this indicator post! Maybe even give me a follow :D
I hope you all enjoy!!
Indicator website: depthhouse.com
Ichimoku Cloud (Log-Space) - perfect trend areaLog space ichimoku cloud which display perfect bearish trend and perfect bullish trend.

Crypto IchimokuIchimoku Cloud with settings recommended for crypto by trader IAmSatoshi. Includes a handy checkbox to double inputs, and alerts that can be set for when the price crosses the bottom or top of the cloud.
This script also includes an ichimoku signal count. The signal count is an UNWEIGHTED sum of positive or negative ichimoku signals with the greatest total being shown in either green(long>short) or red(short>long) or white(0, long==short). The signal count is only shown when their is a new signal or a signal is no longer valid.
If you use a major portion of the code please cite me. If you like the script and make a bunch of money using it, feel free to donate using the crypto addresses below.
BTC: 34uVepgjGJAKqf9i3mfdq8AG1dzTthjCgb
ETH: 0x71B15Beb6AF985853B5fC80205ddb3595C51B63e
LTC: MVzvSu53K5qPfjiQn4nk9D6WVLJKCMzXHJ
DASH: XoKVDBnhiyPvJeyRdpHjcWu1WtVjCbhP68
XMR: 46jnYGp7v5vCSAV8pzGXPbWM7YFiZNB4eaFCHsezitQ46KM1E6FgPM9ZaYJEfDVk5zdKoPQ7vw27ke34jMxERogvJDQhfQW

Bryan - Multi IndicatorCustom Indicator - Developed for a Backtest-Rookies customer and published for testing and acceptance.
Ichimoku + ADX combined indicator with custom entry criteria and plotting for buy signals.

Stratus [DW]This is an experimental study designed to identify trend activity, and potential support and resistance areas.
First, Coefficient of Variation Weighted Moving Average (COVWMA) is calculated, and its intersection points are used as anchor values.
Next, a fast period COVWMA calculated for a signal line.
For the cloud, its mid level is calculated first by taking the median of the range between price and the last anchor value.
The upper and lower cloud values are calculated by slicing the range in half two more times on each side. The result looks similar to stratus clouds, hence the name.
Finally, the result is offset by half of the specified period.
Custom bar colors are included.

Supertrend CloudSupertrend is a simple yet great indicator which is based hard data, especially when combined with an additional ST line which has its multiplication doubled.
Enjoy :)

clouded pastSearch indicators for "clouded" to find this one, and add to your chart.
Takes lowest(min) and highest(max) of several bars,
averages that over several bars,
shifts by half of the middle of those two bar numbers,
and colors the inbetween by candle color.
You can choose 3 parameters.
Please give feedback, or donation.
Thanks.


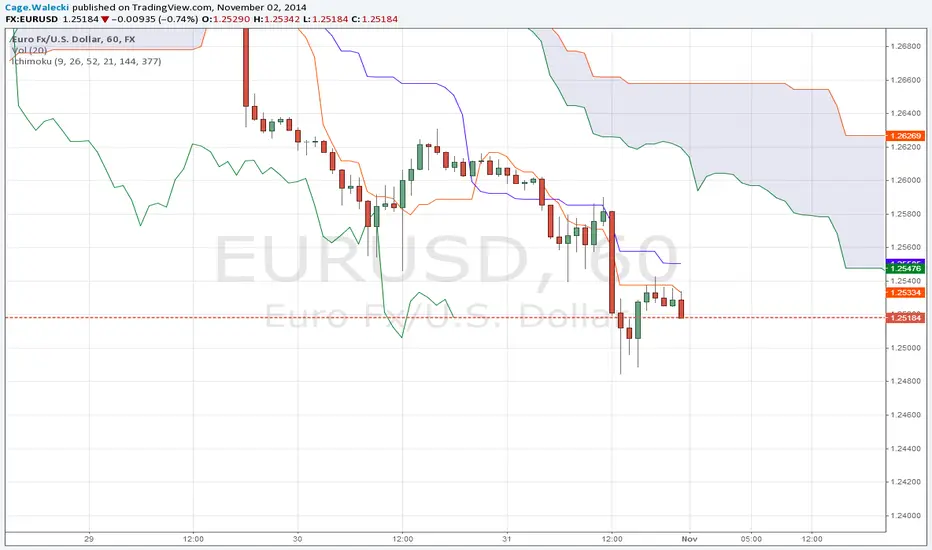
FriendlyTrend Signal//FriendlyTrend Signal//
Our Tradingview representation of our strategy. Trend-Following techniques combining analysis of buying and selling on fractals, entering low-risk positions at counter-trend points, and trailing-stop orders along moving averages.
//Strategy//
Red/Green circles indicate counter-trend entry positions. These are not lagging and form on the closing of the corresponding bar. Best opportunities for a credit, debit, or other defined-risk options spreads and closed if the trade goes against us directionally with the stop loss above the high or below the low of the previous bar on market close.
Lines represent fractal support and resistance. We execute a buy if the moving average cloud is green and the green line is broken and the price closes above. Reverse for selling.
Cloud represents long or short opportunities. If the top cloud and bottom cloud are intertwined we are sidelined & wait for a large move in one direction or the other. The middle moving average is our trailing stop & another counter-trend entry point if a major support level is broken at the moving average itself.
//Still refining the code into a Tradingview Strategy form. More to come...//

Candlestick Patterns Identified (updated 3/11/15)I decided to republish this one without the trend filter and with all the major symbols active. This will allow for all the patterns to show up.
Due to 15 different candlestick formations in this one script, it will be difficult to turn off the last few due to screen size. You can turn off individual patterns on the settings screen.
I have everything spelled out except the hammer and inverted hammer. They are "H" and "IH" respectively on the charts. They show up so often that they cluttered the charts.
The default script has: Doji, Evening Star, Morning Star, Shooting Star, Hammer, Inverted Hammer, Bearish Harami, Bullish Harami, Bearish Engulfing, Bullish Engulfing, Piercing Line, Bullish Belt, Bullish Kicker, Bearish Kicker, Hanging man, and Dark Cloud Cover. You can turn off what you don't like. The Piercing Line, Bullish Belt, and the Kickers will usually show up better in the daily charts.
I recommend watching videos with Stephen Bigalow to get a feel for how to trade these. You will want to add an 8 EMA to your chart with his setups. Enjoy.
If you want the old version: Take a look at the related ideas below.

Ichimoku-Hausky_v2.1Made a little update to my trading system. This system is made so that you can easily follow the trend and know when to get out. You still have to know basic market structure to find a good entry.
NB!! I see that i placed the entry wrong on the example, you have too wait for the EMA to go below the MA :)
I have posted the right one at the bottom.
Take profit can be set at last low or you can use trail stop on the EMA, MA, Kijun-sen or Tenkan-sen.
Example rules:
Buy:
IF Market is in a trend or are possibly close to break out of range
THEN see if price has closed above cloud
IF price has closed above cloud
THEN see if EMA has crossed above MA
IF EMA has crossed above MA
THEN buy or wait for pullback
Sell:
IF Market is in a trend or are possibly close to break out of range
THEN see if price has closed below cloud
IF price has closed below cloud
THEN see if EMA has crossed below MA
IF EMA has crossed below MA
THEN buy or wait for pullback

Ichimoku Cloud ALERTHi, this my new script which show you correct Ichimoku signals, when price exit cloud.
SELL SIGNAL:
- red line below blue
- green line below price
- price exit cloud bottom
- price below 3 EMA's!
BUY SIGNAL:
- red line above blue
- green line above price
- price exit cloud upper
- price above 3 EMA's!
You can change ichimoku parameters and input 3 EMA's. If u dont want use any of the EMA's then input 1 into them.
CM Enhanced Ichimoku Cloud V5Ichimoku Cloud Indicator With Cloud Shading Based On Trend!!!
I’m releasing this Indicator b/c of the New Feature that Allows Coding The Fill of The Cloud To Change Colors Based On Trend. However, I will be releasing a Much More Advanced Version Soon!!!
Current Features - Via Inputs Tab:
- Ability to Turn On/Off Every Plot Individually Via Check Box
- Ability To Turn On/Off Tenkan and Kinjun Crosses (Arrows)
***Features Coming Soon - All Will Have Capability to Turn On/Off:
- Bar Color Change when Entering The Cloud
- Filtered Tenkan and Kinjun Crosses To Plot Only With Trend, only Counter Trend, Or All Crosses
- Plot Arrows When Price Exits The Cloud.
- Plot Arrows When Lagging Line Crosses The Cloud Confirmed, or Not Confirmed by Price.
- Plus More!!!
- Basically Ability To Set Alerts Based On Any Condition!!!
WHAT ARE YOUR REQUESTS FOR FEATURES??? Comment Below.
