TTW-Day/Session Separator🗓️ Day Separator – Highlight Markers start times and days for Your Chart
This script adds automatic vertical lines to visually separate each trading day on your chart. It helps you quickly identify where each day starts and ends — especially useful for intraday and scalping strategies.
✅ Features:
Distinct lines for each weekday, month, week, trading session
Optional day-of-week labels (toggle on/off)
Custom label position (top or bottom of the chart)
Works on any timeframe
Whether you're tracking market sessions or reviewing daily price action, this tool gives you a clean structure to navigate your charts with more clarity.
Dayseparator
D|W|M|Y Breaks with NY TimezoneThis indicator plots breaks for multiple timeframes: Daily, Weekly, Monthly, Quarterly, Half Yearly, Yearly.
I also added the option to change timezone to New York to see the week the ICT way ;)

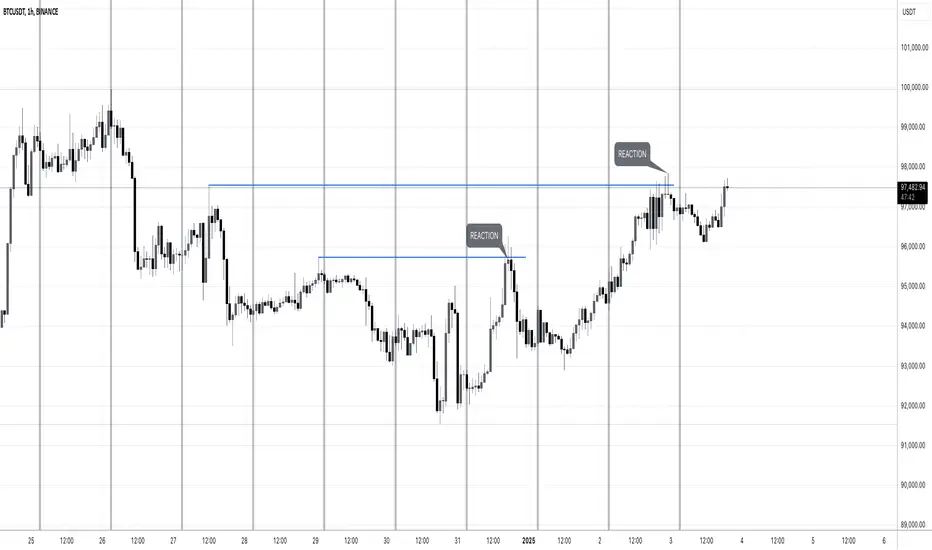
MW:TA Days of the WeekENG: Vertical separators to easily detect days of the week and see which past liquidity was taken down. Screenshot example contains days of the week indicator and manually drawn lines of grabbed liquidity. Useful for trades based on liquidity grab and reaction.
Tested on Forex, Crypto, Indexes, Stocks, Commodities markets.
-
РУС: Вертикальные разделители для визуального определения дней недели и просмотра снятой ликвидности на графике. На скриншоте отмечен индикатор разделительных периодов (дней) и вручную нарисованные линии, которые отмечают снятую ликвидность и реакцию цены на снятие. Полезно для тех трейдеров, которые торгуют по реакции на снятую ликвидность.
Протестировано на рынках Форекс, Крипто, ИНдексов, Акций и Сырья.
Multi-Timeframe Period Separators█ OVERVIEW
This indicator plots period separators for up to four higher timeframes. The separators are fully customizable and designed to work on any symbols.
█ FEATURES
Reference
You can choose to plot the separators starting from midnight 00:00 or the opening of the exchange trading session.
Timezone
You can specify to localize midnight 00:00 to the region of your liking. The timezone format conveniently requires no manual adjustment during clock changes.
█ NOTES
Scans the bar opening and closing times
The script checks the bar ` time ` and ` time_close ` to pinpoint the separators that can occur intrabar.
Tracks from the last separator
The script tracks the time elapsed since the last separator, which is useful when there is no trading activity or the market is closed. As it can result in missing bars, it plots the separator on the first available bar.
Others
The script automatically hides the separators when navigating to an equal or higher chart timeframe.

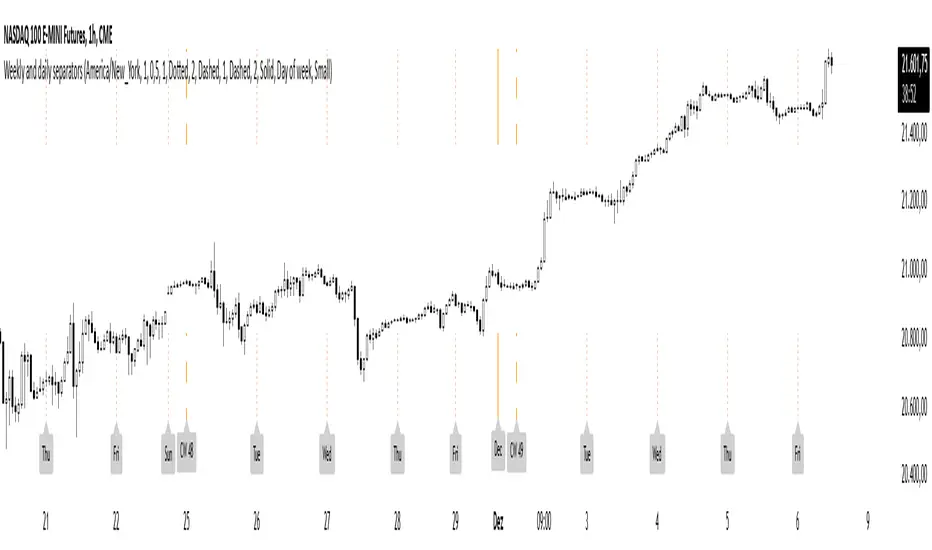
Weekly and daily separatorsThis script plots vertical line between each trading week (thick, solid) and smaller lines (dotted) between each trading day. This helps kepping a better overview on the aspect of time on the higher timeframes below 1D. The distance of the lines to the top and bottom of the chart is controlled by your chart settings menu under Appearance -> Margins.